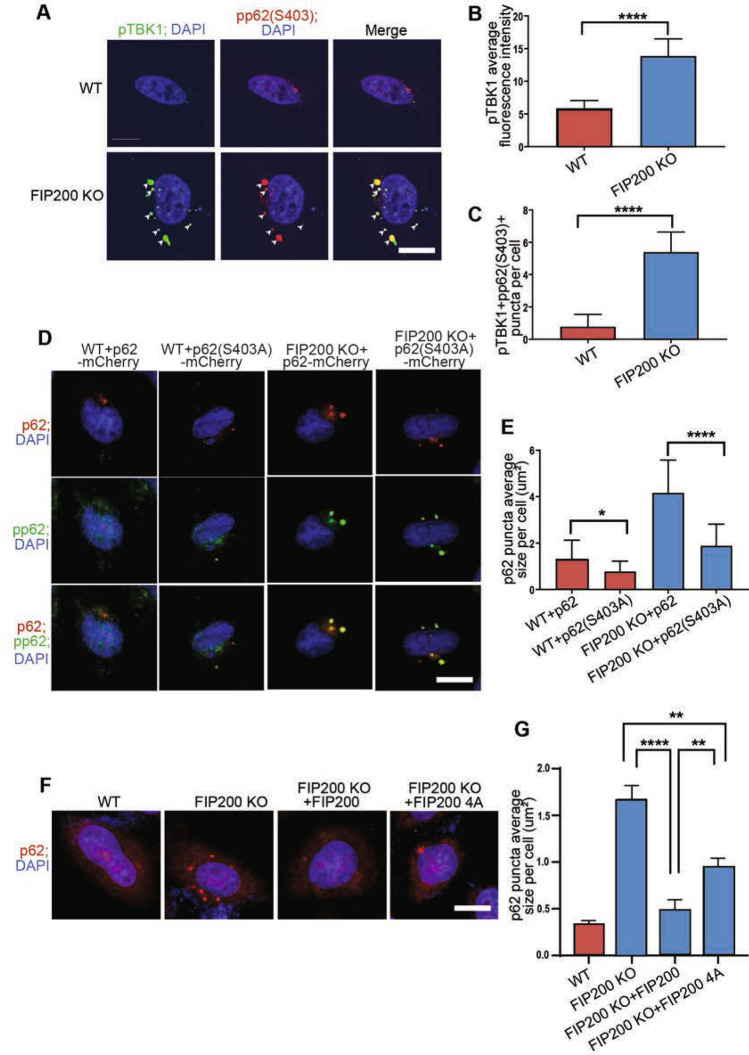
Figure 3.
TBK1 phosphorylation of p62 at S403 promotes its aggregates formation in FIP200 KO cells specifically. (A) Representative immunofluorescence images for phosphorylated TBK1 and p62 (S403) in WT and FIP200 KO HeLa cells. (B,C) Quantification of (B) pTBK1 + fluorescence intensity per cell and (C) pp62(403) + and pTBK1 + puncta number per WT and FIP200 KO cell. (D) Representative immunofluorescence images for mCherry fused p62 and p62 (S403A) mutant as well as their phosphorylated versions (pp62 and pp62(S403A) mutant) in WT and FIP200 KO HeLa cells, respectively. (E) Quantification of p62 and p62 (S403A) puncta size per WT and FIP200 KO cell. (F) Representative immunofluorescence images of p62 in WT and FIP200 KO HeLa cells expressing empty Vector, FIP200 or FIP200-4A. (G) Quantification of p62 + puncta size per cell in (F). Scale bars: 10 µm. *, P < 0.05; **, P < 0.01; ****, P < 0.0001. Graphs represent mean ± SEM.

