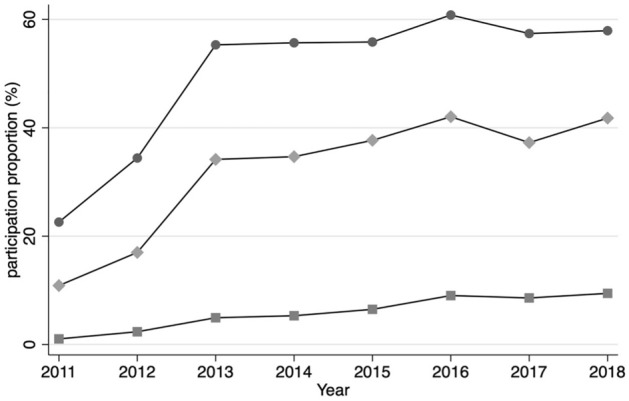
Figure 2.

Participation trends by tendency to undergo CRC screening before the disaster. The line graphs with round dots show the proportions of those who participated in CRC screening in both 2009 and 2010 before the earthquake, while the line graphs with diamonds show the proportions of those who participated CRC screening either in 2009 or 2010, and the line graphs with squares show the proportions of those who did not participate CRC screening in 2009 or 2010.
