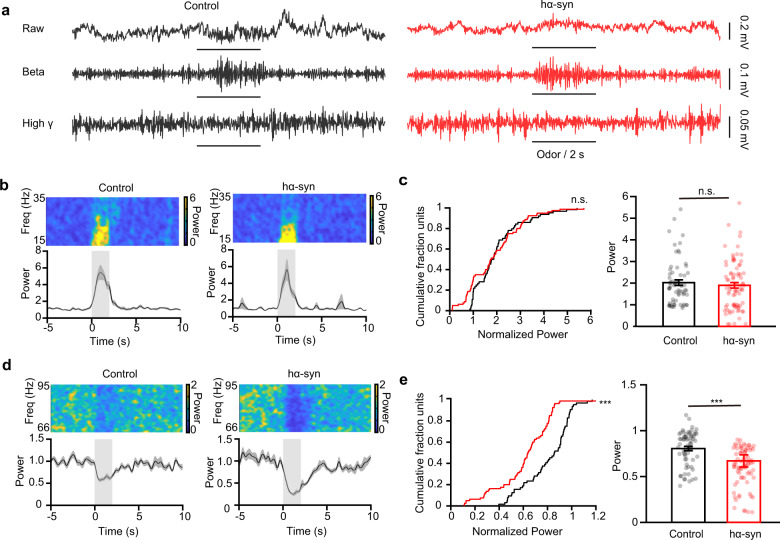
Fig. 4. α-Synuclein aggregates change the odor-evoked high-gamma response in the OB.
a Examples of raw traces (top) and filtered beta (middle) and high-gamma (bottom) oscillations in the LFP signals recorded from representative control and hα-syn mice in vivo with odor stimulation. b, d Example power spectra (top) and trial-averaged normalized traces (bottom) of beta (b) and high-gamma (d) responses elicited by isoamyl acetate delivery (gray boxes). c, e Power in the normalized odor-evoked beta band (c) and high-gamma band (d) in the two groups (odor–mouse pair: n = 64 for the control group; n = 80 for the hα-syn group). ***p < 0.001; n.s. not significant. Data are presented as mean ± SEM.

