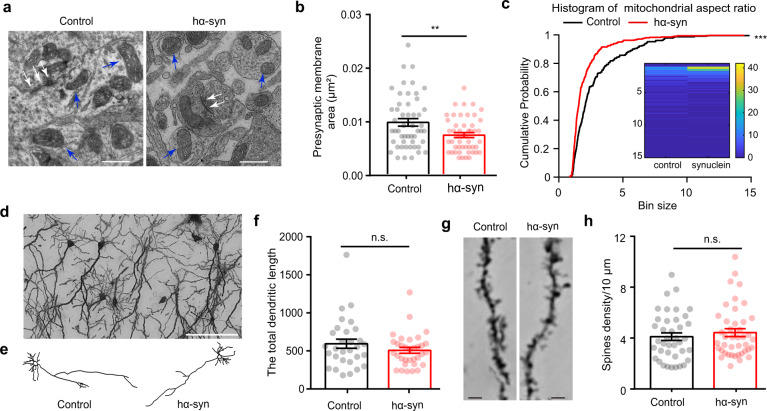
Fig. 8. Morphological changes induced by α-synuclein aggregation in the olfactory bulb.
a Representative electron micrograph showing the synaptic ultrastructure (white arrows) and mitochondria (blue arrows) in neurons. Scale bars = 500 nm. b Quantitative analysis of the area of the presynaptic membrane in the two groups of mice (control: n = 51 synapses from 4 mice; hα-syn: n = 49 synapses from 4 mice). c Quantitative analysis of the mitochondrial aspect ratio (control: n = 231 mitochondria from 4 mice; hα-syn: n = 343 mitochondria from 4 mice). d Representative Golgi staining photomicrograph showing neurons in the granule cell layer of the OB. Scale bars = 20 μm. e Representative reconstructions of granule cells from the OB of mice in the two groups. f Comparison of the total dendritic length of granule cells in the two groups of mice (control: n = 29 cells from 4 mice; hα-syn: n = 32 cells from 4 mice). g Representative dendrites and spines of granule cells obtained from control and hα-syn mice. Scale bars = 2 μm. h Spine density on granule-cell dendrites (control: n = 39 dendrites from 3 mice; hα-syn: n = 42 dendrites from 3 mice). **p < 0.01; ***p < 0.001; n.s. not significant. Data are presented as mean ± SEM.

