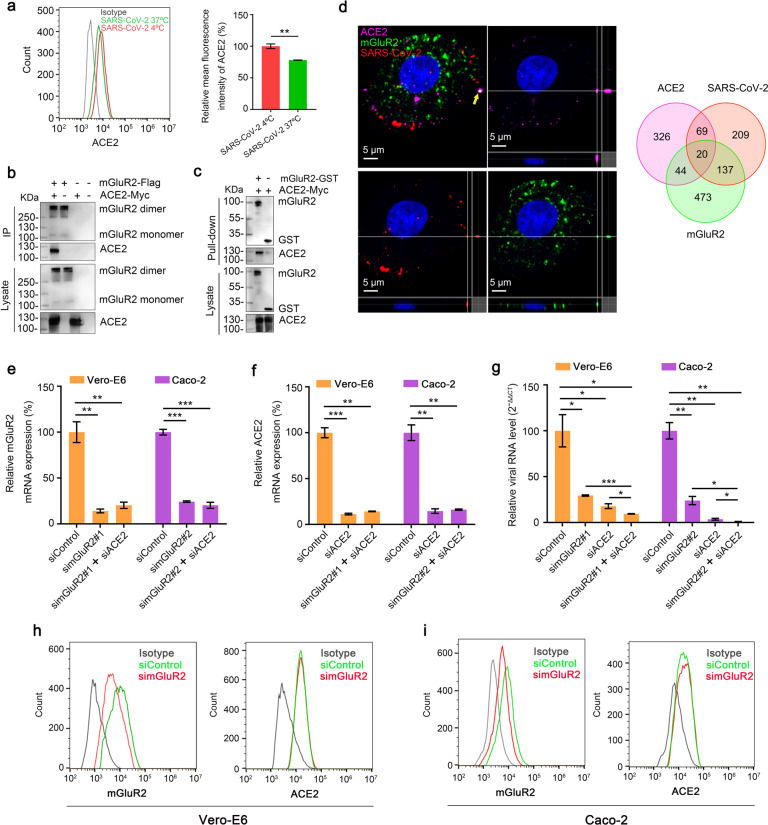
Fig. 3. mGluR2 interacts with ACE2.
a The surface expression level of ACE2 was detected by using flow cytometry after infection with HRB25 at 37 °C for 30 min under unpermeabilized conditions in Vero-E6 cells. b HEK293 cells were co-transfected with mGluR2-Flag and ACE2-Myc. Cell lysates were immunoprecipitated by using anti-Flag agarose beads. c mGluR2-GST was pooled with lysate from ACE2-Myc-transfected HEK293 cells and then pulled down by using anti-GST beads. d Multiplex immunofluorescence was performed in Vero-E6 cells. Colocalization of mGluR2 (green), SARS-CoV-2 N protein (red), and ACE2 (purple) was observed and quantified. The yellow arrowhead indicates the representative colocalization of mGluR2 (green), SARS-CoV-2 N protein (red), and ACE2 (purple), shown in three dimensions. e, f Knockdown of mGluR2 (e) or ACE2 (f) was measured by use of qPCR in Vero-E6 cells and Caco-2 cells. simGluR2#1 and simGluR2#2, siRNAs specific for mGluR2 mRNA from monkey and human, respectively; siACE2, siRNA specific for ACE2; siControl, scrambled RNA. g mGluR2-silenced, ACE2-silenced Vero-E6 cells, or Caco-2 cells were infected with HRB25. At 24 h p.i., virus in the cell lysate was detected by use of qPCR. h, i The cell surface expression of mGluR2 or ACE2 in mGluR2-silenced Vero-E6 cells (h) or Caco-2 cells (i) was detected by flow cytometry. The data shown are representative results from three independent experiments (a, e–g n = 3), means ± SD, Student’s t-test, *P < 0.05, **P < 0.01, ***P < 0.001.

