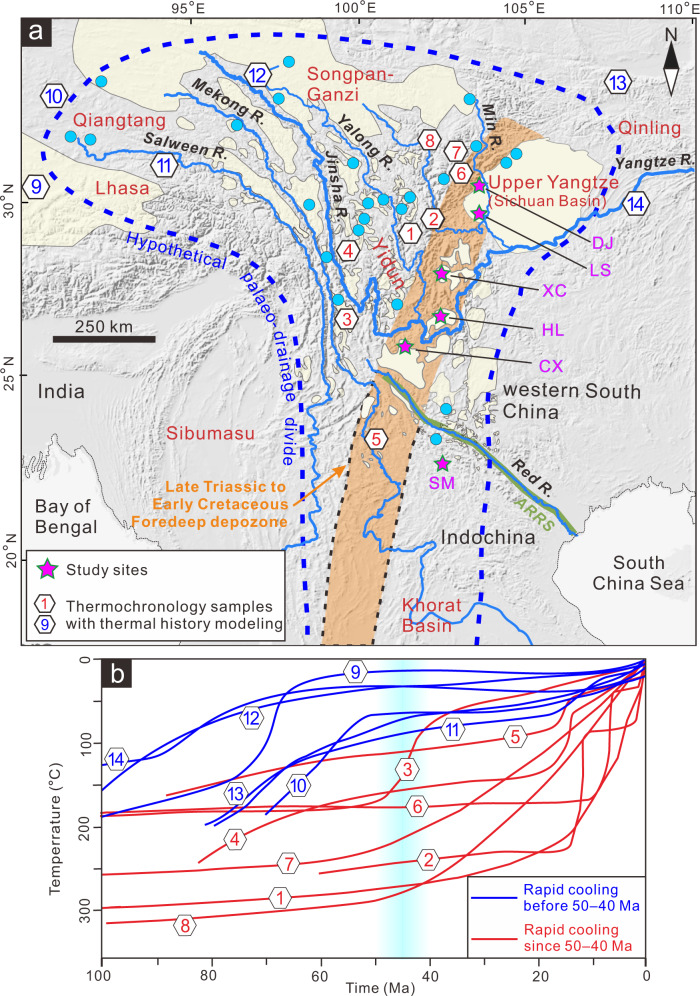
Fig. 1. Location map of study area and thermal modelling results of thermochronological data in eastern Tibet and surrounding areas.
a Map showing main tectonic units (red text) and major river systems. Light yellow polygons indicate mapped low-relief surfaces (modified after refs. 20,61). Blue circles correspond to AFT and AHe thermochronological ages of ~50–100 Ma from low-relief plateau areas24,31–34,36,67. Hexagons indicate sites with late Cretaceous–early Palaeogene cooling histories (shown in Fig. 1b). Dashed blue line represents the hypothetical drainage divide of late Cretaceous to early Palaeogene drainage system. Orange area marks the inferred location of a late Triassic to early Cretaceous foredeep depozone (cf. refs. 20,27). Abbreviations for sites: ARRS Ailaoshan–Red River shear zone, DJ Dujiangyan area, LS Leshan area, XC Xichang Basin, HL Huili Basin, CX Chuxiong Basin, SM Simao Basin. b Red lines indicate slow cooling rates (~1 °C/Ma) during late Cretaceous to early Palaeogene, whereas blue lines show more rapid cooling rates (~5–10 °C/Ma) during the same period. Light blue vertical band indicates age range (~50–40 Ma) of the onset of rapid cooling in eastern Tibet. 1–ref.24; 2–ref. 12; 3–ref. 36; 4–ref. 65; 5–ref. 66; 6–ref. 35; 7,8–ref. 28; 9–ref. 31; 10–ref. 37; 11,12–ref. 32; 13–ref.34; 14–ref. 38. See Fig. 1a for localities. (The shaded-relief map is generated by Xudong Zhao using DEM data (https://www.ngdc.noaa.gov/mgg/topo/) and ArcGIS software).

