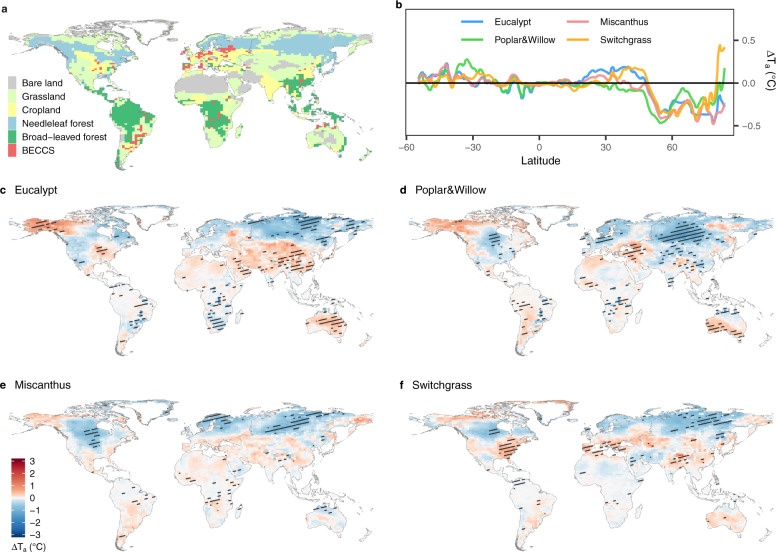
Fig. 1. Bioenergy crop cultivation map and air temperature change over land.
a The composite bioenergy crop cultivation map where red grid cells represent the bioenergy crop cultivation regions (i.e., BECCS regions) and the main vegetation type in each grid cell is shown outside the BECCS regions. c–f Air temperature changes (ΔTa) induced by cultivation of each bioenergy crop type based on the composite cultivation map with their zonal averages shown in (b). Black shading in c–f indicates grid cells with significant (p < 0.1) change in air temperature.

