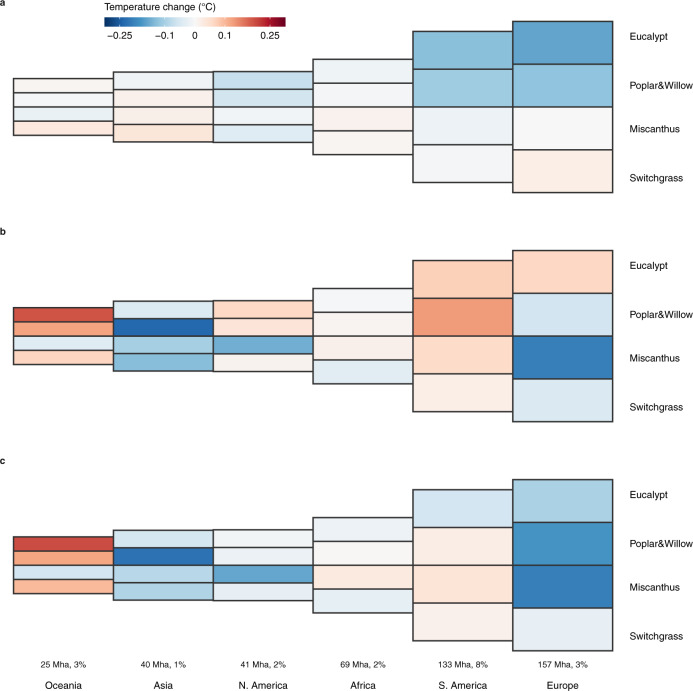
Fig. 3. Bioenergy crop cultivation area and mean temperature change in each continent.
Air temperature changes induced by altered local surface energy balance (a) and by atmospheric circulation (b) and the net air temperature change (c) are the average values over the whole continent. Sizes of rectangles represent relative bioenergy crop cultivation areas in different continents in the composite cultivation map, and color gradients indicate temperature change. Numbers show the area of bioenergy crop cultivation in each continent (left, M ha) in the composite cultivation map and its proportion of the total continental area (right, %).

