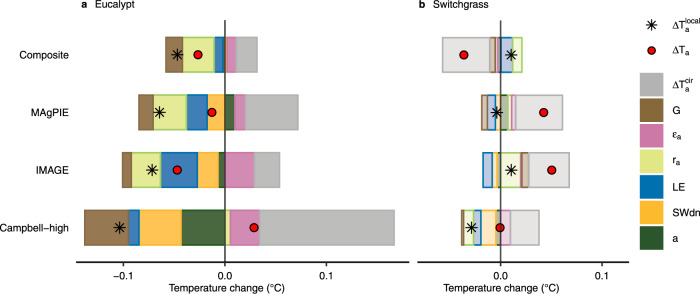
Fig. 4. Contributions of different components to air temperature changes at the global scale using different cultivation maps.
Two panels represent eucalypt cultivations (a) and switchgrass cultivation (b). Four rows of bars represent four cultivation maps (i.e., the composite, MAgPIE, IMAGE, and Campbell-high map). Bars for, G, εa, ra, LE, SWdn, and α represent different components that contribute to the air temperature change, i.e., the altered atmospheric circulation, ground heat flux, longwave radiative emissivity of air, aerodynamic resistance, latent heat flux, surface downward shortwave radiation, and surface albedo, respectively. The net air temperature change is shown by red dots, which is the sum of all bars. Black asterisks represent the contribution of altered local surface energy balance, which is the sum of the colored bars excluding the gray bar.

