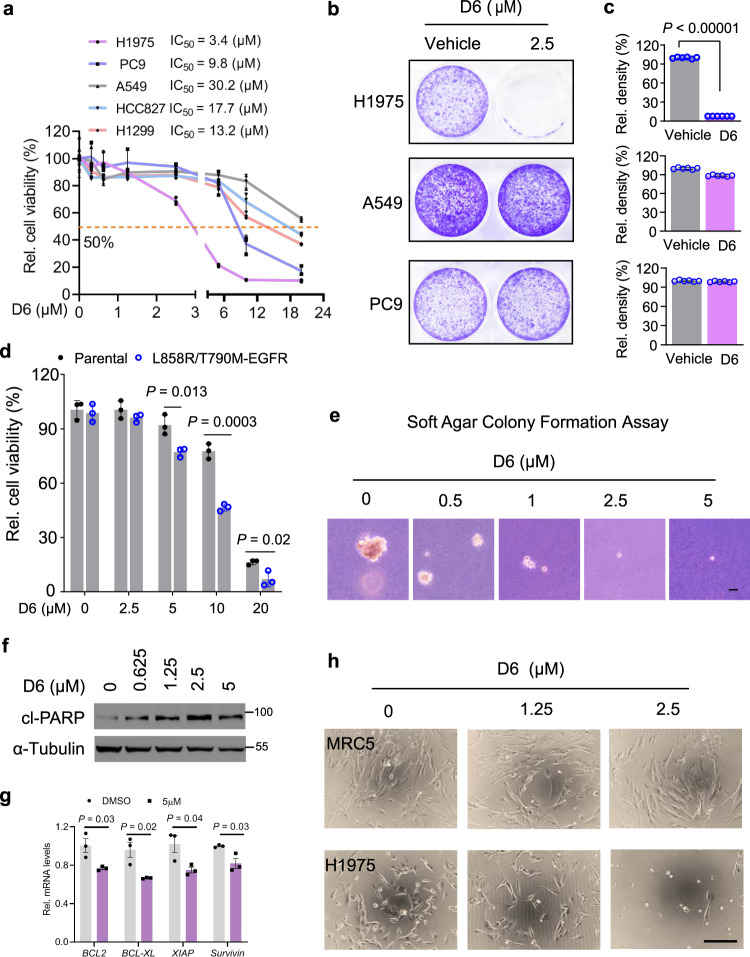
Fig. 1. D6 inhibits the viability of NCI-H1975 cells.
a PC9, H1299, A549, HCC827, and NCI-H1975 cells were treated with a range of concentrations of D6 for 72 h. Cell viability was detected by CCK8 and shown as relative viability compared to the control. b, c Representative images showed the cell proliferation of NCI-H1975, A549, and PC9 cells exposed to D6 (2.5 µM) and solvent DMSO. The bars of (c) represented the relative cell density. d HCC827 parental cells or the isogenic cells expressing L858R/T790M-EGFR were treated with the indicated concentrations of D6 for 72 h. Cell viability (%) was shown after normalized to the control group. e Representative images showed the cell growth of NCI-H1975 cells cultured in soft agar with the indicated concentrations of D6. Scale bar, 200 µm. f Immunoblotting analysis showing the levels of cleaved-PARP (cl-PARP) in NCI-H1975 cells treated with indicated doses of D6. g Quantitative PCR analysis showing the levels of anti-apoptosis genes in NCI-H1975 cells in the presence of D6 or not. h Representative images showing the effect of D6 on NCI-H1975 cells and normal lung fibroblast MRC5 cells. Scale bar, 200 µm. Data are presented as mean ± SEM (a, c, and g), n = 3 (a and g) or 6 (c) biologically independent samples. P values were calculated by two-tailed Student’s t-test.

