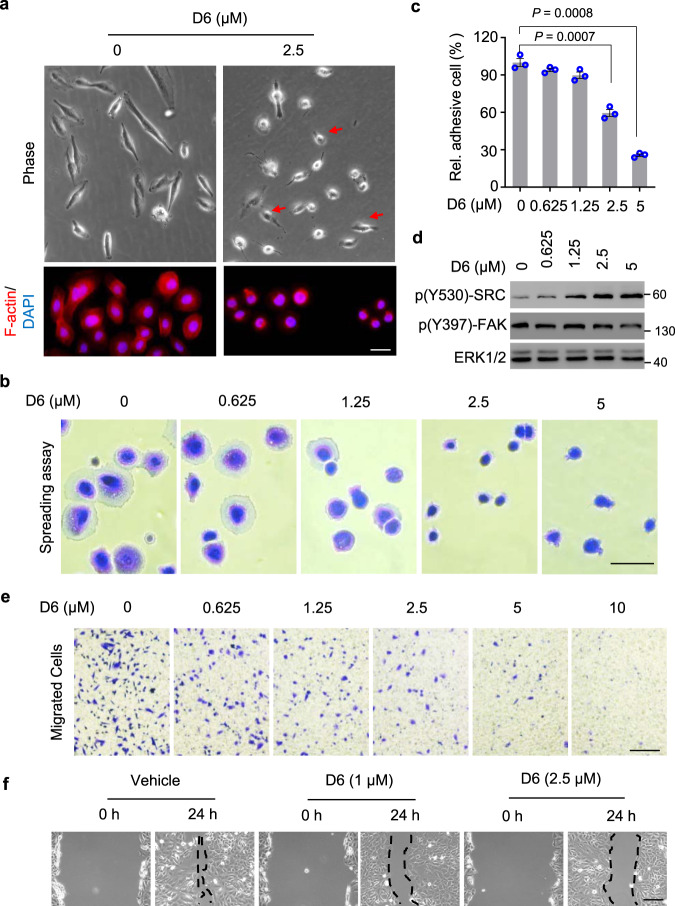
Fig. 2. D6 inhibits NCI-H1975 cell migration.
a Representative images showing the cell morphology of NCI-H1975 cells post D6 exposure. Scale bar, 100 µm. b, c Representative images (b) showing NCI-H1975 cells spreading on cell culture plate with D6 incubation or not. The adhesive cells were counted and normalized to the solvent control (c). Scale bar, 50 µm. d Immunoblotting analysis of cell lysates prepared from NCI-H1975 cells exposed to different concentrations of D6. e NCI-H1975 cells with D6 pretreatment were subjected to transwell assay. The migrated cells were stained by 0.1% crystal violet solution. Scale bar, 200 µm. f Representative images showing the wound-healing assay for NCI-H1975 cells followed with D6 treatments. The dash line indicated the edge of wound closure. Scale bar, 200 µm. Data represent mean ± SEM (c), n = 3 biologically independent samples. P values were calculated by two-tailed Student’s t-test.

