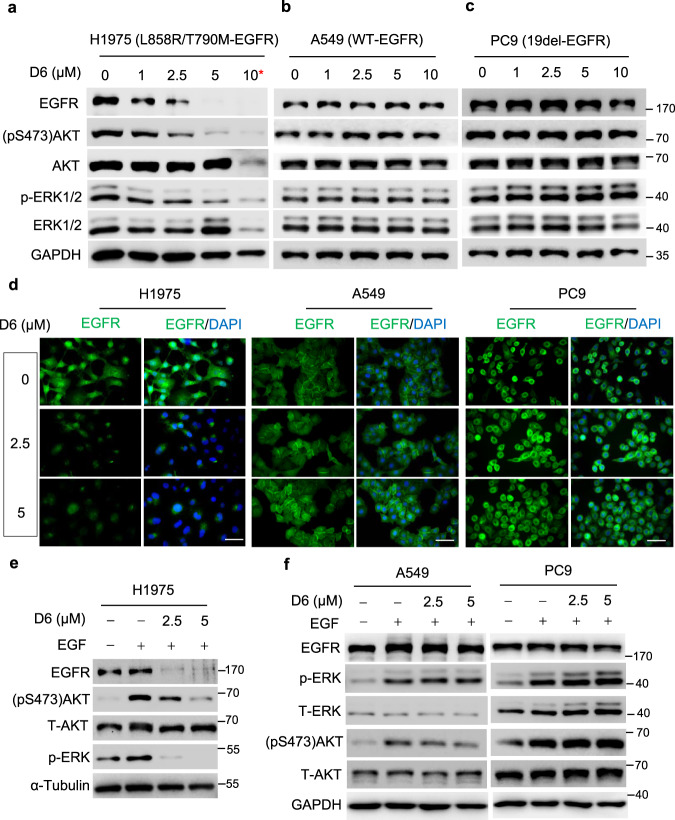
Fig. 3. D6 suppressed EGFR expression in NCI-H1975 cells.
a−c NCI-H1975, A549, and PC9 cells were treated with indicated concentrations of D6 for 24 h. Cell lysates were prepared and subjected to immunoblotting analysis. *D6 resulted in cell death at the dose of 10 μM and led to total protein decrease. d Representative images showing the EGFR levels evaluated by immunofluorescent staining. NCI-H1975, A549, and PC9 cells were treated with D6 for 24 h and then fixed, permeabilized and incubated with anti-EGFR antibody. After incubation with an FITC-conjugated secondary antibody, nuclei were stained with DAPI. Scale bars, 50 µm. e, f Immunoblotting analysis of cell lysates derived from NCI-H1975, A549, and PC9 cells with or without D6 and EGF (10 ng/µl) treatment.

