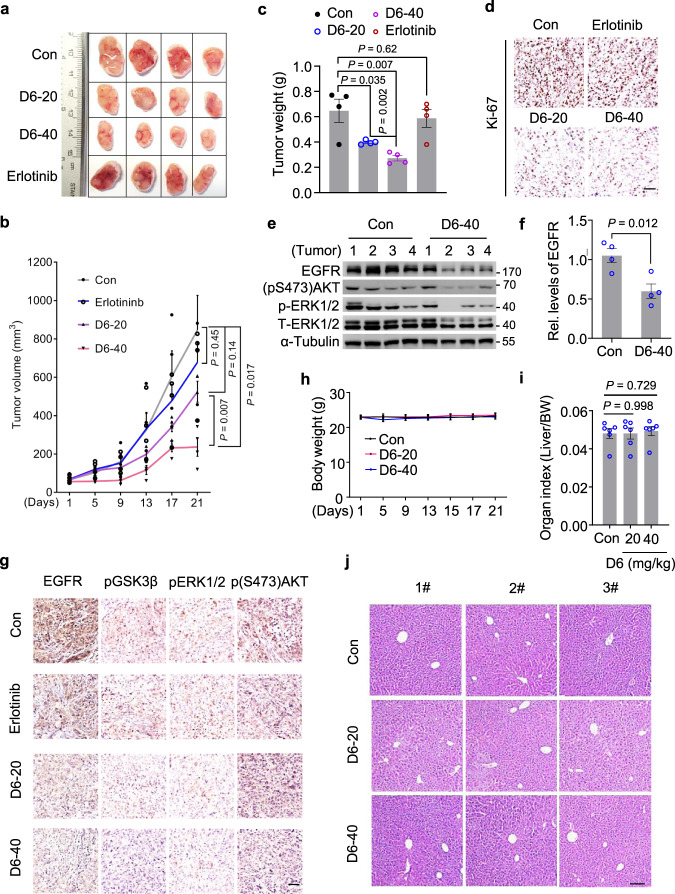
Fig. 6. D6 inhibits the growth of xenografts developed from NCI-H1975 cells.
a Nude mice inoculated with NCI-H1975 cells were randomly divided into four groups (n = 4 mice per group). When tumor volume reached ~100 mm3, mice were administered (i.p.) with D6 (20 or 40 mg/kg) or erlotinib (100 mg/kg), respectively. The remaining mice injected with an equivalent volume of solvent were taken as control. After 21 days, mice were sacrificed and tumors were collected for analysis. b, c Tumor volume (b) and tumor weight (c) were analyzed in each group of mice. To calculate tumor volume, the tumor width and length were measured by a caliper. d Representative images showing the IHC staining of Ki-67 expression in tumors isolated from (c). Scale bar, 100 µm. e, f Immunoblotting analysis of protein lysates isolated from tumors in (c). EGFR expression levels were quantified (f), n = 4 mice for indicated groups. g Representative images showing the IHC staining of indicated proteins in tumors isolated from (c). Scale bar, 100 µm. h−j Mouse body weight (h), mouse liver organ index (i), and mouse liver histological morphology (j) were analyzed post-application with indicated dosages of D6. Con: solvent solution; D6-20 or D6-40: mice treated with D6 at the dose of 20 or 40 mg/kg. Data are presented as mean ± SEM, n = 4 mice (b, c, and f) or n = 6 mice (i). P values were calculated by two-way ANOVA analysis (b) or two-tailed Student’s t-test (c, f, and i).

