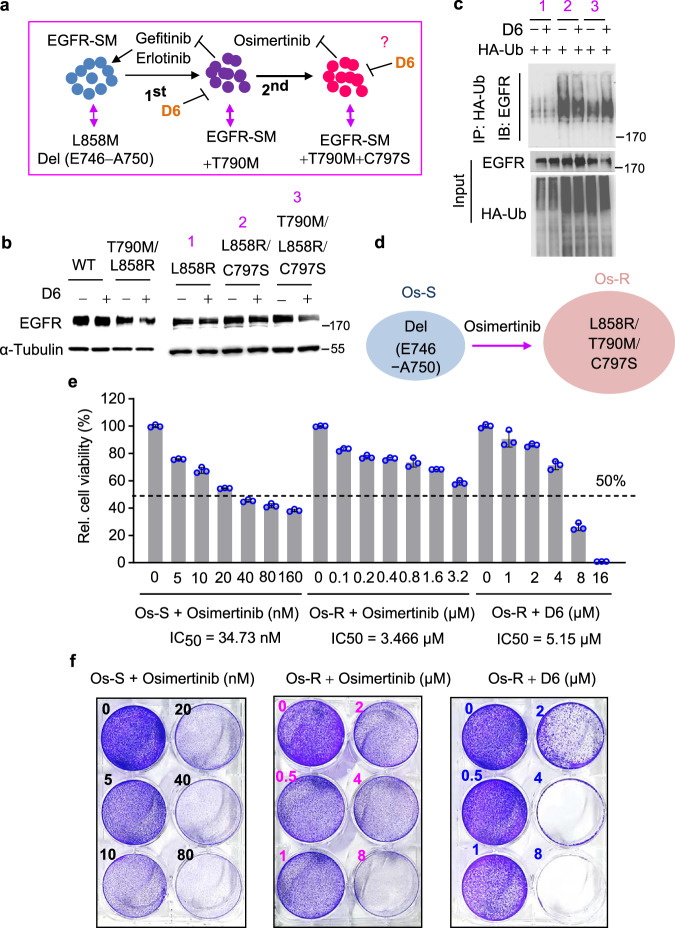
Fig. 7. D6 overcomes osimertinib resistance in NSCLCs.
a Schematic diagram illustrating the development of EGFR-TKI resistance. b Immunoblotting analysis showing the expression of indicated EGFR mutants transfected into HEK293 cells and treated with or without D6 (2.5 µM). The numbers 1, 2, and 3 represented indicated EGFR mutants. c Cell lysates derived from HEK293 cells transfected with HA-Ub and indicated EGFR mutants with D6 (2.5 μM) treatment or not were incubated with anti-HA beads. The elution of anti-HA beads was then subjected to immunoblotting analysis. d Schematic diagram showing the generation of osimertinib-resistant PC9 cells (Os-R) from the osimertinib-sensitive parental cells (Os-S). e Os-S or Os-R cells were treated with the indicated concentrations of osimertinib or D6. Cell viability was detected by CCK8 and displayed after normalized to the control. f The representative images showing the cell proliferation of Os-S or Os-R cells exposed to the indicated concentrations of osimertinib or D6 for long-term culture in 6-well plate. Data are presented as mean ± SEM (e), n = 3 biologically independent samples.

