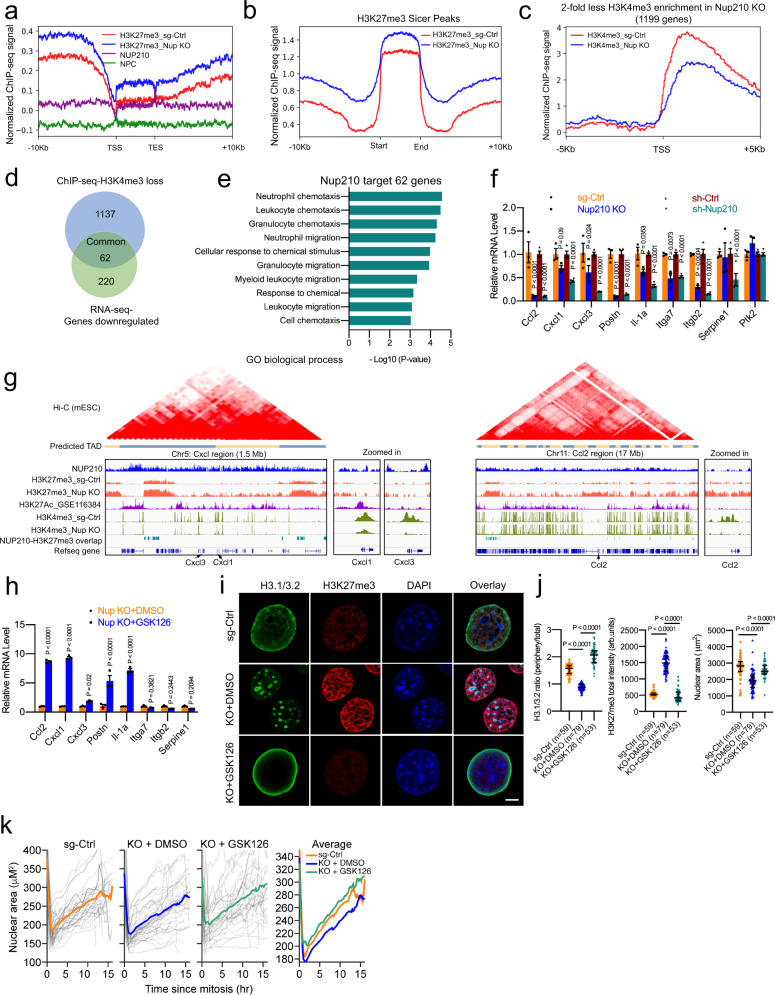
Fig. 5. Loss of NUP210 is associated with H3K27me3-marked heterochromatin spreading in 4T1 cells.
a H3K27me3 peak enrichment on gene bodies in Nup210 KO cells within NUP210-enriched regions. b H3K27me3 ChIP-seq profile in sg-Ctrl and Nup210 KO cells. c H3K4me3 ChIP-seq profile on gene promoters in sg-Ctrl and Nup210 KO cells. d Overlap of genes with H3K4me3 loss on the promoter and downregulated expression in Nup210 KD cells. e Gene Ontology (GO) analysis of overlapped genes from (d). f qRT-PCR analysis of cell migration-related genes in Nup210 KO and KD 4T1 cells. Multiple two-tailed t test, mean ± s.e.m, n = 3 biological replicates (sg-ctrl vs Nup210 KO), n = 4 biological replicates (sh-Ctrl vs sh-Nup210). g Representative ChIP-seq (NUP210-, H3K27Ac-, H3K27me3- and H3K4me3) tracks with predicted TADs within Cxcl and Ccl2 region. h qRT-PCR analysis of cell migration-related genes in DMSO- and GSK126-treated Nup210 KO 4T1 cells. Multiple two-tailed t test, mean ± s.e.m, n = 3 biological replicates. i Representative images of H3.1/3.2 and H3K27me3 distribution in DMSO- and GSK126-treated Nup210 KO cells. Scale bar = 5 μm. j H3.1/3.2 intensity ratio, H3K27me3 intensity and nuclear area quantification in DMSO- and GSK126-treated Nup210 KO 4T1 cells. Kruskal–Wallis ANOVA with Dunn’s multiple comparison test, error bar represents median with interquartile range. ‘n’ in X-axis is the number of cells analyzed per condition. k Live-cell tracking of a nuclear area in DMSO- and GSK126-treated Nup210 KO cells. n = 40 (sg-Ctrl), n = 41 (KO + DMSO), and n = 31 cells analyzed per conditions.

