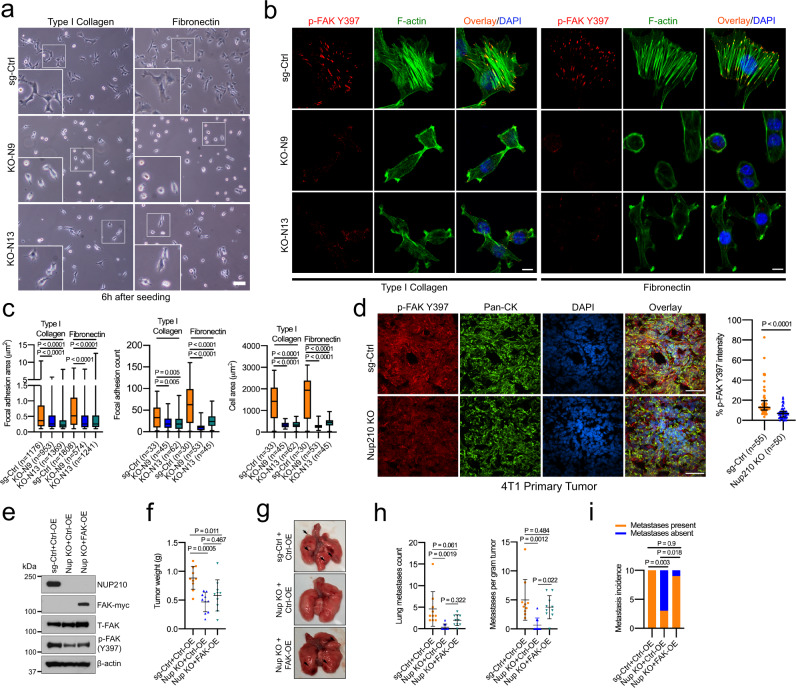
Fig. 6. Nup210 regulates focal adhesion of tumor cells.
a Representative brightfield images of 4T1 Nup210 KO cells on type I collagen and fibronectin. Scale bar = 100 μm. b Representative images of p-FAK (Y397) focal adhesions and F-actin in sg-Ctrl and Nup210 KO cells on type I collagen and fibronectin. Scale bar = 10 μm. c Quantification of focal adhesion area, count, and cell spreading in sg-Ctrl and Nup210 KO 4T1 cells. ANOVA with Tukey’s multiple comparison correction. The box represents the 25th to 75th percentile, whiskers represent data range, and the horizontal line represents the median. d (Left) Immunostaining of Nup210 KO (KO-N13) 4T1 primary tumors with p-FAK Y397 and pan-cytokeratin (Pan-CK) antibodies. Scale bar = 50 μm. (Right) quantification of p-FAK Y397 signal in the Pan-CK-stained tumor area. N = 5 mice per condition, ~10 independent fields per mouse tumor section. Mann–Whitney U test, median with interquartile range. e Western blot of myc-tagged FAK overexpression in Nup210 KO 4T1 cells. f Primary tumor weight in FAK-overexpressing Nup210 KO (KO-N13) 4T1 cells. ANOVA with Tukey’s multiple comparison correction, mean ± s.d. n = 10 mice per group. g Representative lung images of the mice injected with FAK-overexpressing Nup210 KO cells. h Lung metastasis count and metastases normalized to tumor weight in FAK-overexpressing Nup210 KO cells. ANOVA with Tukey’s multiple comparison correction, mean ± s.d. n = 10 mice per group. i Metastasis incidence in mice injected with FAK-overexpressing Nup210 KO cells. χ2 test with Bonferroni correction. n = 10 mice per group.

