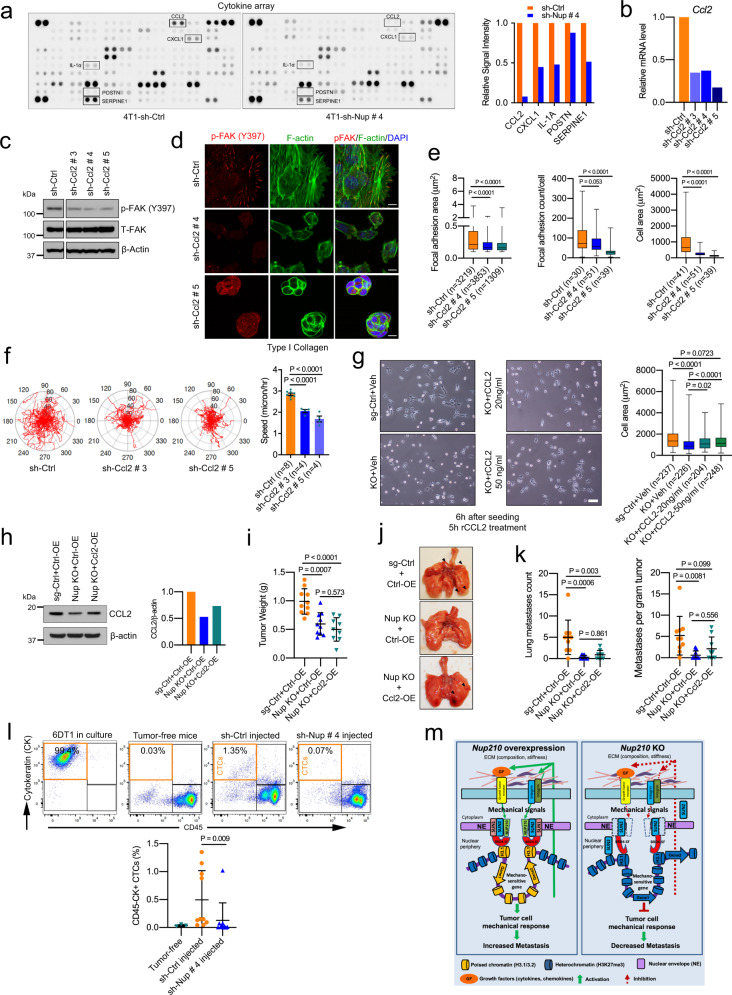
Fig. 9. NUP210 regulates circulating tumor cells in mice.
a Cytokine analysis and quantification of boxed cytokines of supernatants from sh-Ctrl and Nup210 KD 4T1 cells. b qRT-PCR analysis of Ccl2 KD in 4T1 cells. c Western blot of p-FAK Y397 and T-FAK proteins in Ccl2 KD 4T1 cells. d p-FAK (Y397) focal adhesion and F-actin distribution in sh-Ctrl and Ccl2 KD 4T1 cells. Scale bar = 10 μm. e Quantification of focal adhesion area, count, and cell spreading in sh-Ctrl and Ccl2 KD 4T1 cells. ANOVA with Tukey’s multiple comparison correction, box represents 25th to 75th percentile, whiskers represent data range, and the horizontal line represents median. ‘n’ equals the number of cells analyzed. f Cell migration tracks and quantification of sh-Ctrl and Ccl2 KD 4T1 cells. Average cell speed analyzed by ANOVA with Dunnet’s multiple comparison test, mean ± s.e.m. ‘n’ equals the number of independent replicates. g Brightfield images and quantification of cell area of 4T1 Nup210 KO cells treated with Ccl2. ANOVA with Tukey’s multiple comparison correction, box represents 25th to 75th percentile, whiskers represent data range, and the horizontal line represents median. ‘n’ equals the number of cells analyzed. h Western blot and signal quantification of Ccl2 overexpression in Nup210 KO 4T1 cells. i Tumor weight of mice injected with Ccl2-overexpressing Nup210 KO 4T1 cells. ANOVA with Tukey’s multiple comparison correction, mean ± s.d. For sg-Ctrl+Ctrl-OE and Nup KO + Ctrl-OE, n = 10 mice; for Nup KO + Ccl2-OE, n = 9 mice. (j) Representative lung images from the mice from (i). k Lung metastases count and metastasis normalized to tumor weight from the mice injected in panels i and j. ANOVA with Tukey’s multiple comparison test, mean ± s.d. For sg-Ctrl+Ctrl-OE and Nup KO + Ctrl-OE, n = 10 mice; for Nup KO + Ccl2-OE, n = 9 mice. l (Top) Flow cytometry analysis of CD45−/CK+ circulating tumor cells (CTCs) and (bottom) quantification of CTCs in Nup210 KD 6DT1 cell-injected animals. Kruskal–Wallis ANOVA with Dunn’s multiple comparison test, mean ± s.d. Tumor-free, n = 3 mice; sh-Ctrl and sh-Nup # 4, n = 10 mice. m Proposed model of NUP210’s metastatic role.

