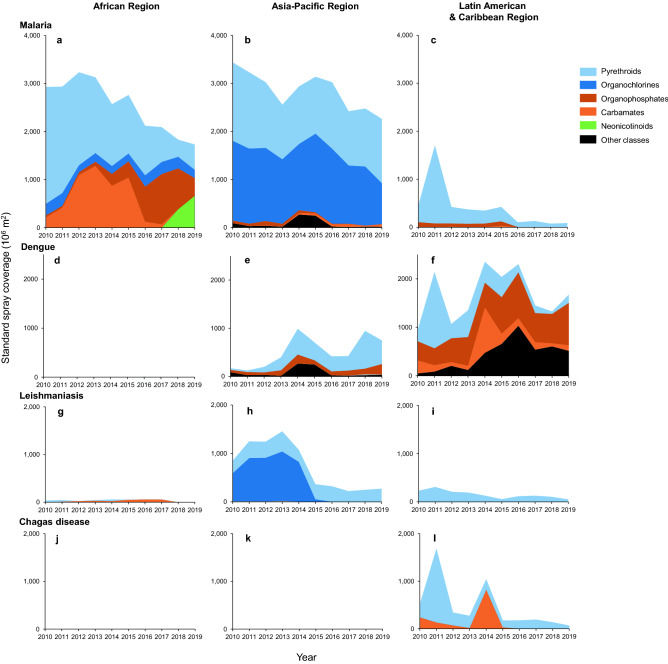
Figure 4.
Area graph of vector control insecticide use, excluding use in ITNs, by disease. Results are presented for three geopolitical regions, (a–c) for control of malaria, (d–f) dengue, (g–i) leishmaniasis, and (j–l) Chagas disease, and expressed in standard spray coverage. Shades of blue or shades of red indicate insecticide sub-groups within a mode of action21. ‘Other classes’ represent bacterial larvicides, insect growth regulators and spinosyns (all used as larvicides).

