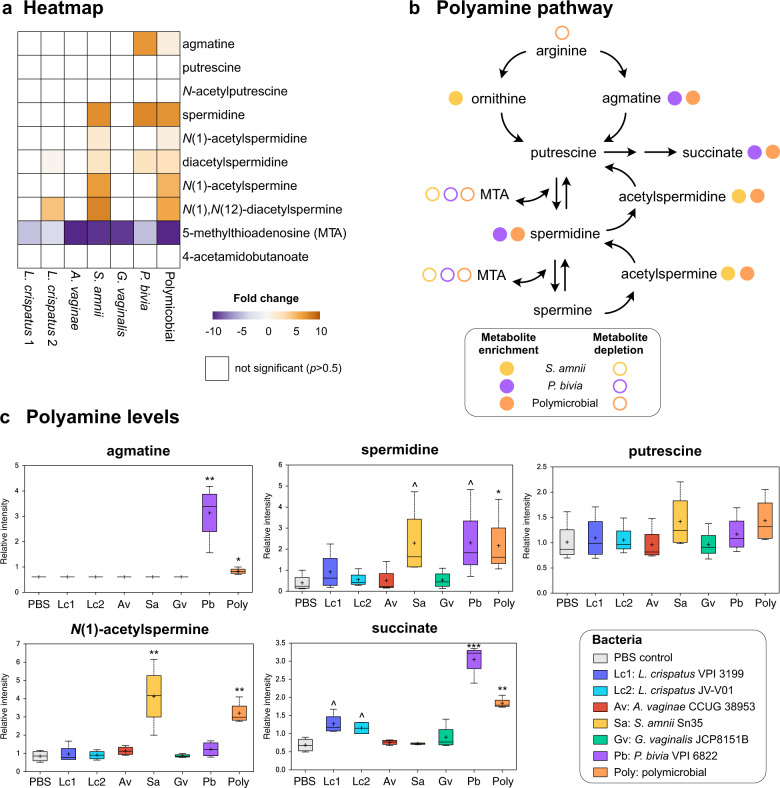
Fig. 6. BVAB induce production of polyamines in a species-specific manner in a human 3D cervical model.
P. bivia and S. amnii contribute to agmatine, spermidine, and N(1)-acetylspermine production, whereas A. vaginae does not induce production of bioamines similarly to L. crispatus. a The heatmap shows fold changes of the metabolites related to the polyamine pathway among bacterial infections compared to uninfected controls. Only the fold changes that were significant (p < 0.05) are displayed. Gold- and purple-shaded squares indicate metabolite enrichment or depletion, respectively. b A schematic of polyamine metabolism pathways. Colored circles indicate enriched or depleted metabolites following monoinfection with specific BVAB or infection with the polymicrobial cocktail. c Floating bar graphs shows relative intensity of polyamines in 3D cell culture supernatants following bacterial colonization. The relative intensities of polyamines and related metabolites are shown as floating bar graphs. The boxes represent the median and interquartile range and whiskers range from minimum to maximum values. A plus sign (+) on plots indicates mean values. Significant differences between mean intensities of metabolites among infections were determined using Welch’s two-sample t test with FDR correction. p and q values are indicated by ^(p < 0.05, q > 0.01), *(p < 0.05, q < 0.01), **(p < 0.01, q < 0.01), ***(p < 0.001, q < 0.01).

