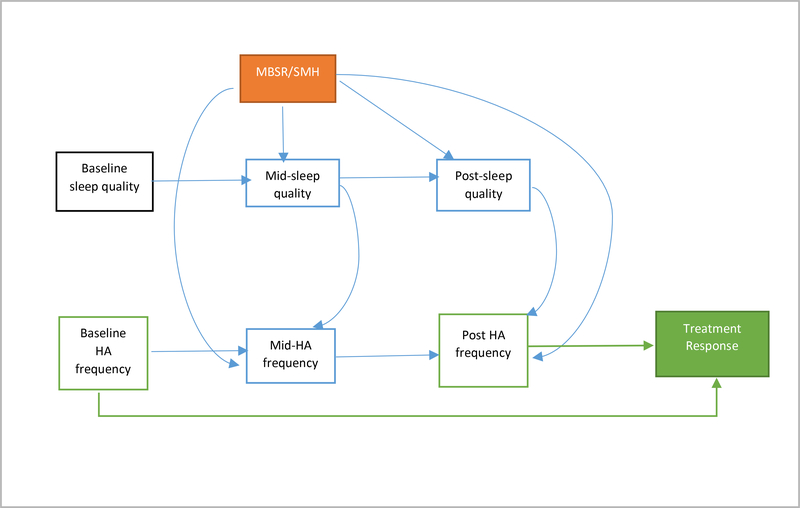
Figure 2: Causal diagram to represent plausible mediation relationship between MBSR+ and treatment response.
Arrows assume direction of causal relationships. Model assumes no unmeasured confounding. Black boxes indicate baseline covariates. Solid black arrows represent adjusted confounding. The orange box indicates the randomized treatment MBSR+ vs. SMH. The solid green box is the outcome which is treatment response. This variable is created from baseline and post-intervention headache frequency (green outlined boxes) Blue boxes represent possible mediators of the relationship between exposure and outcome. Baseline covariates were measured prior to randomization and therefore are not affected by the treatment. Mid-point (10 weeks post baseline) sleep quality, anxiety, depression and stress were measured at the scan visit directly after the completion of the first block of treatment. Headache diaries were completed for 28 days post the first block of treatment and therefore are captured after the psychosocial measurements. Post-treatment (20 weeks post baseline) psychosocial measurements were taken at the scan visit directly after the final treatment block had been completed. These visits usually occur over a two-week period post study completion. Headache diaries are completed for 28 days post treatment.

