
Fig. 3. Image analysis techniques for the study of actin dynamics.
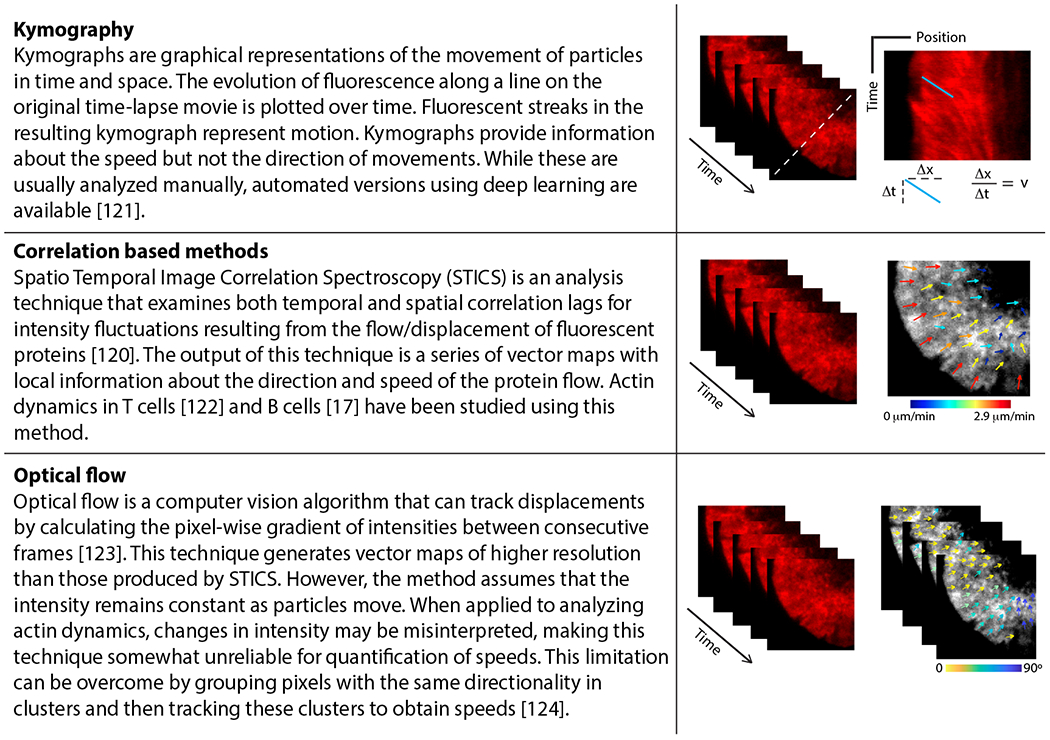
Spatial and temporal changes in the fluorescence intensity of F-actin markers can be tracked using several techniques as described here. Top panel: Kymography. Slope of fluorescent streaks in the kymograph represents the speed (v) of the moving particle; Middle panel: Correlation-based methods. Color-coded arrows represent local speed (color and length of arrows) and direction of flows; Bottom panel: Optical flow. Color-coded arrows represent directionality of clusters. These methods enable quantification of the speed and directionality of actin flows, allowing a more complete characterization of actin dynamics during B-cell immune synapse formation.