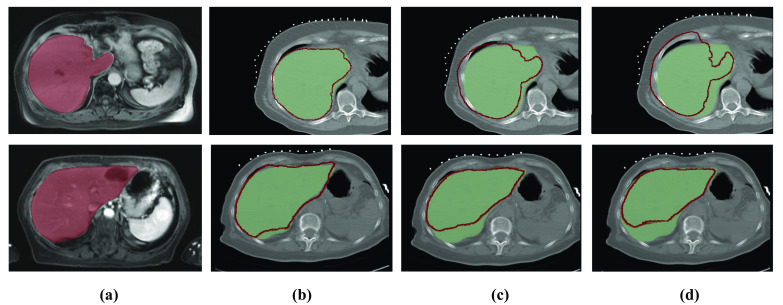
Fig. 4.

Visualization of liver contours presented in the preprocedural MR image (red contours) and intraprocedural CT image (green region). (a) Preprocedural MR image with expert-defined liver region (red region), (b)−(d) Intraprocedural CT image, (b) Successful registration with a DSC of 0.89 (top) and 0.92 (bottom), (c) Poor registration with a DSC of 0.69 (top) and 0.78 (bottom), (d) Poor registration MR image with a DSC of 0.64 (top) and 0.65 (bottom). Note that the MR image is the floating image and the CT image is the reference image in these examples
