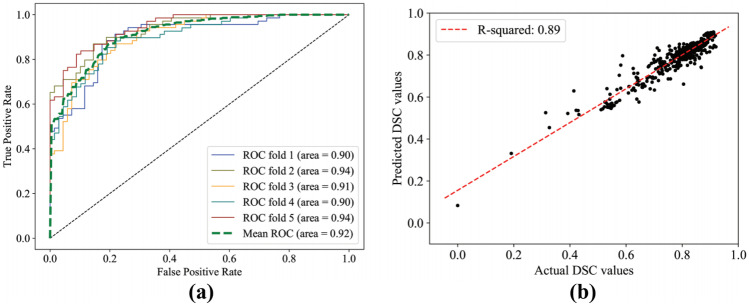
Fig. 7.
(a) ROC curve of fivefold cross-validation for the binary classifier. The mean ROC curve is calculated by averaging validation curves of all of the folds. (b) Scatter plot of the actual and predicted DSC values from the Random Forest regression model. The result of linear regression is depicted by the dashed line

