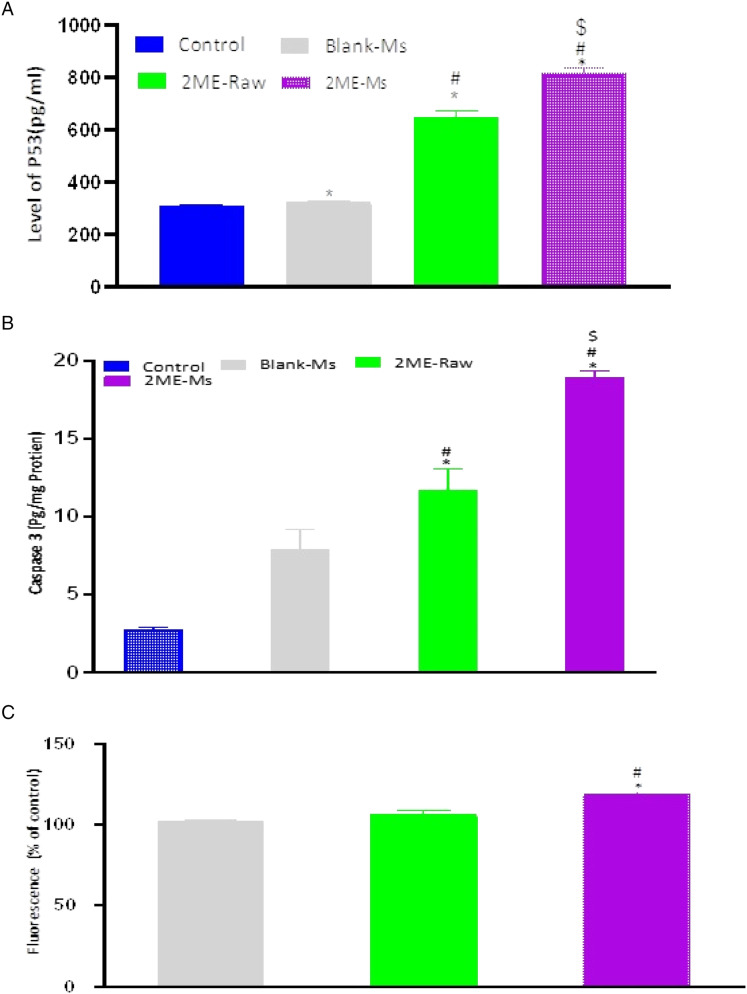
Figure 6.
P53 gene expression (A), Caspase-3 expression (B) and ROS (C) evaluation in MCF-7 cells after treatment with plain-NPs, raw-2 ME and 2ME-ALA-NPs. Values are expressed as mean ± SD (n =3). *Significantly different from untreated cells at P < .05. # Significantly different from plain-NPs at P < .05. $ Significantly different from plain-NPs at P < .05.

