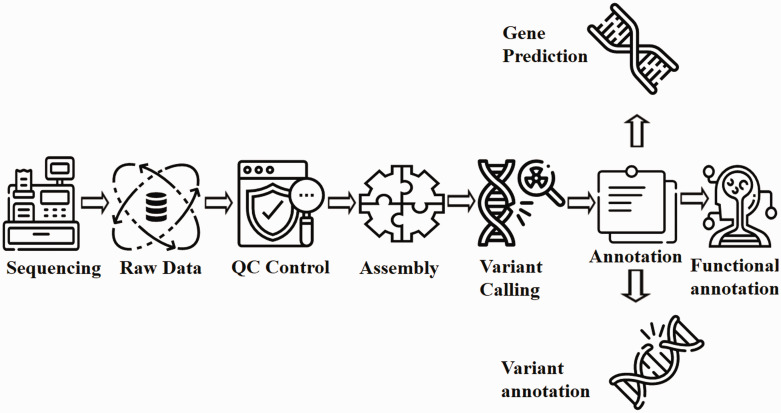
Figure 3.
Flow chart for WGS analysis pipeline. Raw data generated from the sequencing process undergoes extensive cleaning and quality control. Thereafter, the filtered reads are joined together via de-novo or comparative assembly to form contiguous sequences (contigs). Contigs are connected via scaffolding to obtain draft assemblies. Thereafter, the assembled genome is searched for variants and annotated for identifying gene locations, determining the function of those genes and quantifying the impact of variation on proteins. Readers may employ either Genobuntu (Abbas WA, Genobuntu Package for Next Generation Sequencing. http://sourceforge.net/projects/genobuntu/) or Baari, both providing sufficient tools and software for the entire analysis pipeline.26–30

