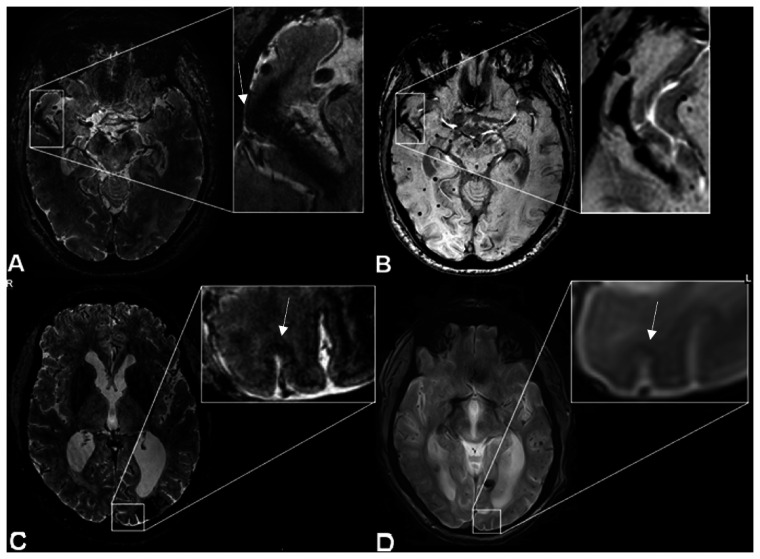
Figure 1.
Intragyral hemorrhage and striped occipital cortex on 7 T- and 3 T-MRI. MRI scans of a patient with sCAA showing: (a) intragyral hemorrhage on T2*-weighted 7 T-MRI, showing cortical involvement (arrow), (b) the same intragyral hemorrhage on susceptibility weighted (SWI) 3 T-MRI, (c) striped occipital cortex on T2*-weighted 7 T-MRI (arrow), and (d) on SWI 3 T-MRI (arrow).

