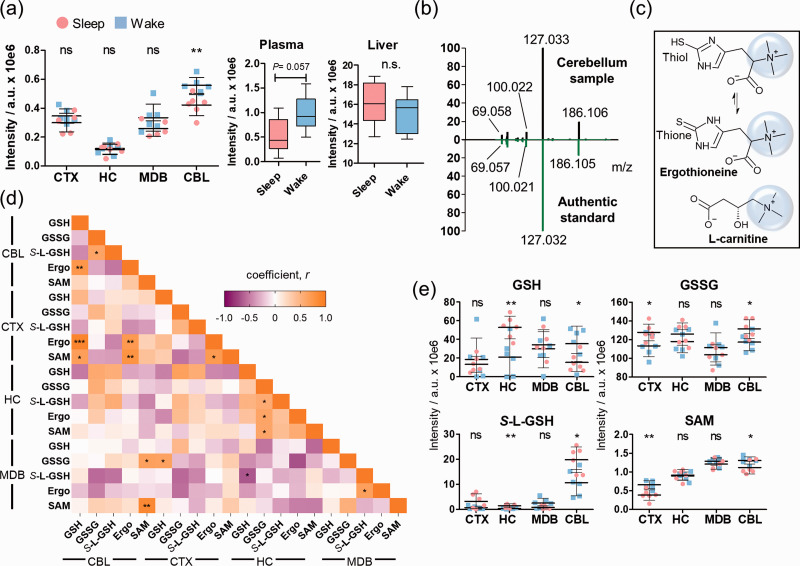
Figure 2.
Brain regional effects of sleep on the microbiome-derived metabolite ergothioneine. (a) Mass spectrometric intensities of ergothioneine ([M + K]+) in the investigated brain regions, plasma and liver ([M + H]+) (N = 6); (b) Structure validation of ergothioneine by comparison of tandem spectra collected from cerebellum (black) and an authentic standard (green); (c) Chemical structures of ergothioneine and carnitine; (d) Heatmap of the correlation coefficients between ergothioneine and other sulfur containing molecules; (e) Distribution of S-L-GSH, GSH, GSSG, and SAM in the brain regions (N = 6). Error bars: standard deviation (SD). Two-tailed unpaired t-test: *P < 0.05, **P < 0.01, ***P < 0.001.
CBL: cerebellum; CTX: cortex; HC: hippocampus; MDB: midbrain; Ergo: ergothioneine, GSH: glutathione; GSSG: oxidized glutathione; S-L-GSH: S-lactoyl-glutathione; SAM; S-adenosyl-methionine.

