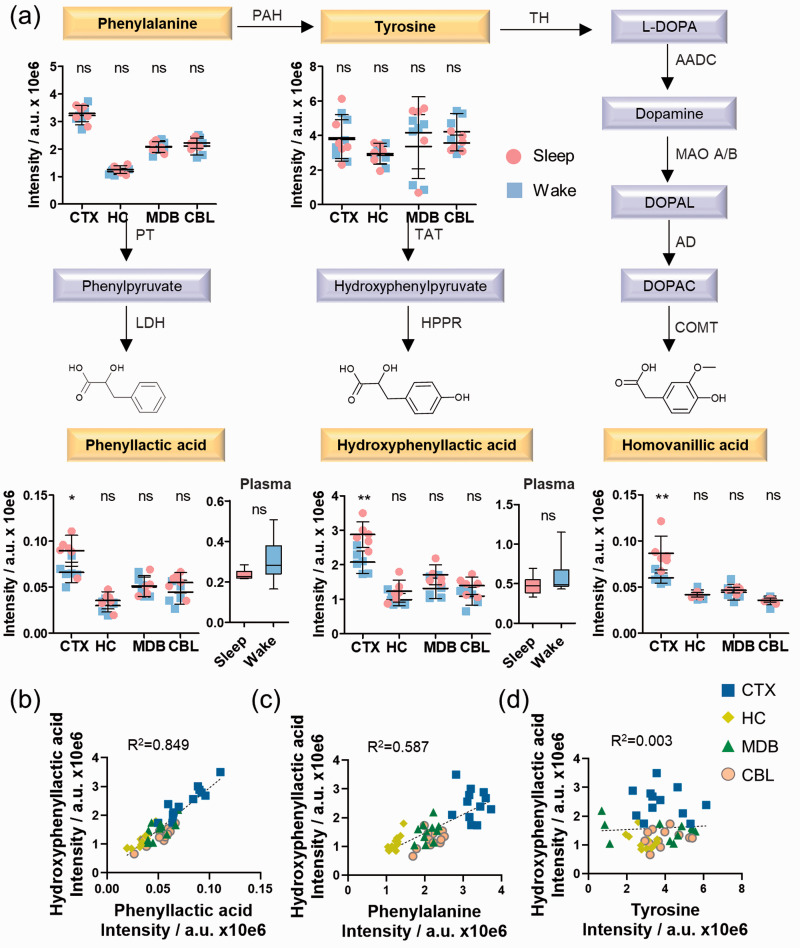
Figure 4.
Sleep-induced cortical alterations in phenylalanine and tyrosine metabolism. (a) UPLC-MS intensities of phenylalanine, tyrosine, phenyllactic acid, hydroxyphenyllactic acid, and homovanillic acid in the investigated brain regions for the day/night sample sets (N = 6) as well as phenyllactic acid and hydroxyphenyllactic acid in plasma (N = 6); (b) Similarity analysis of phenyllactic acid and hydroxyphenyllactic acid; (c) Similarity analysis of phenylalanine and hydroxyphenyllactic acid; (d) Similarity analysis of tyrosine and hydroxyphenyllactic acid; (b–d) Analysis in each brain region (N = 6). Error bars: standard deviation (SD); Two-tailed unpaired t-test: *P < 0.05, **P < 0.01, ***P < 0.001.
AADC: aromatic L-amino acid decarboxylase; AD: aldehyde dehydrogenase; COMT: catechol-O-methyl transferase; HPPR: hydroxyphenylpyruvate reductase; LDH: lactate dehydrogenase; MAO: mono-amino oxidase; PAH: phenylalanine hydroxylase; PT: phenylalanine transaminase; TAT: tyrosine aminotransferase; TH: tyrosine hydroxylase.

