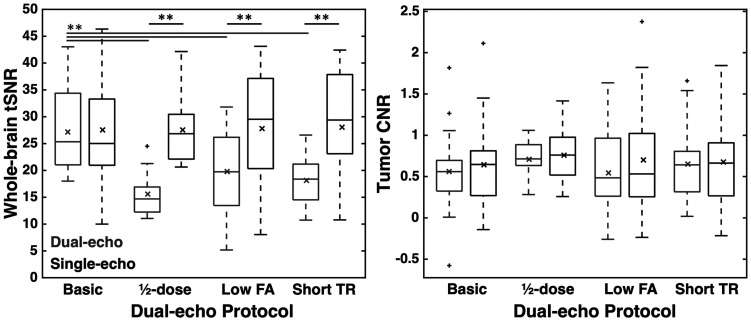
Figure 2.
Whole-brain tSNR and tumor CNR across injections and protocols. Dual-echo and single-echo values are shown in gray and black, respectively. Horizontal bar in each boxplot indicates median value, while x marker indicates mean values. ** indicates p < 0.01 (black: between single- and dual-echo; gray: between dual-echo protocols).

