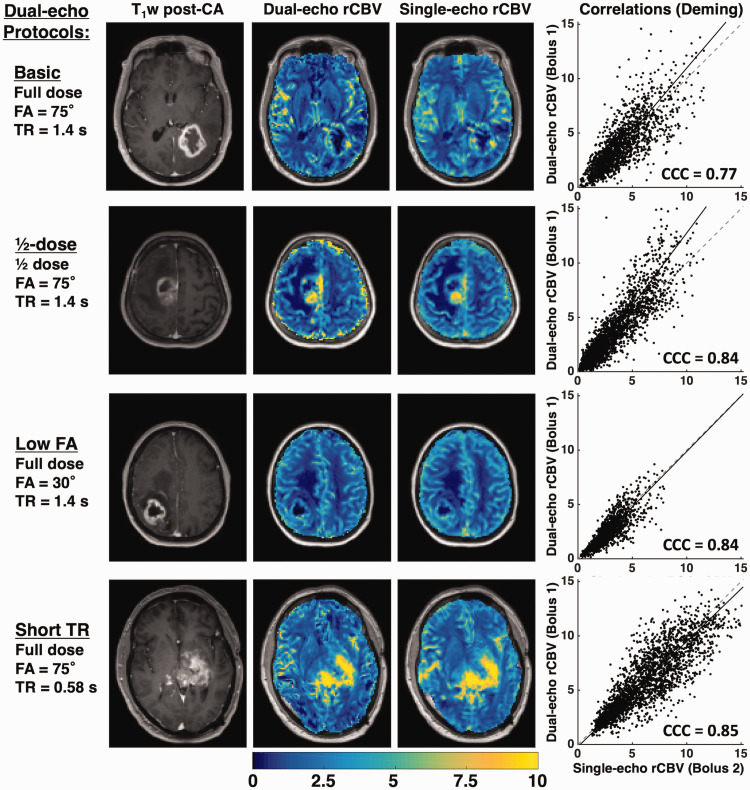
Figure 3.
T1-weighted post-contrast image, dual-echo and single-echo rCBV maps, and voxel-wise correlation plots for representative cases from each protocol. The correlation plots show the line of unity (dashed) and the best-fit line from Deming regression (solid line). The CCC is shown for each plot. All tumors shown are high-grade gliomas.

