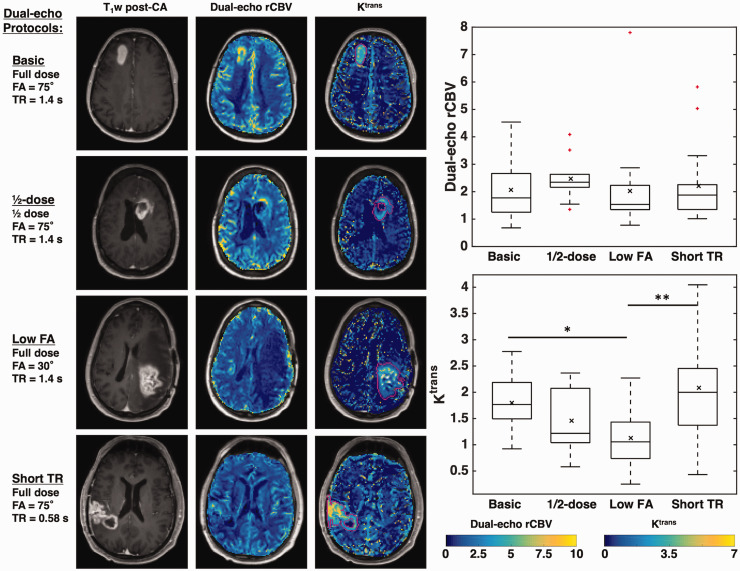
Figure 5.
Left: T1-weighted post-contrast image, dual-echo rCBV maps, and maps of Ktrans of representative cases from each protocol. All tumors shown are high-grade gliomas. Right: Boxplots showing dual-echo rCBV (top) and Ktrans (bottom) values across protocols. Horizontal bar in each boxplot indicates median value, while x marker indicates mean values. * indicates p < 0.05, ** indicates p < 0.01.

