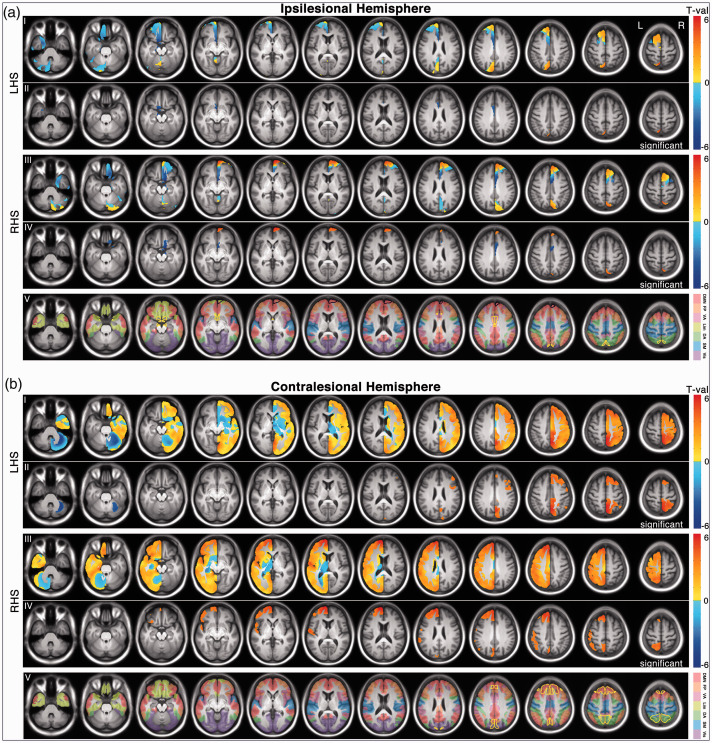
Figure 2.
Longitudinal GMV changes (from 2 weeks to 3 months post onset) for both patient groups. (a) The statistical t maps and significant clusters of the ipsilesional hemisphere. For the ipsilesional hemisphere, the searching mask for GMV change includes only the GM voxels that were intact across all patients, therefore just occupying a portion of the entire hemispheric GM mask (∼20%). (b) The statistical t maps and significant clusters of the contralesional hemisphere. In both A and B, row I and III represent un-thresholded t maps; Row II and IV represent thresholded t maps (corrected p <.05). Notably, the identified within-group clusters separately from the LHS or RHS group may survive neither statistical significance of determining common and unique GMV changes between the two groups, and therefore may not be necessarily classified as common or unique regions in Figures 3 to 5. The contour of common and unique regions between the two groups was displayed in yellow and black, respectively (row V). In the row V, the Yeo’s 7 networks were overlapped on the slices. 50 LHS, left hemisphere stroke; RHS, right hemisphere stroke.

