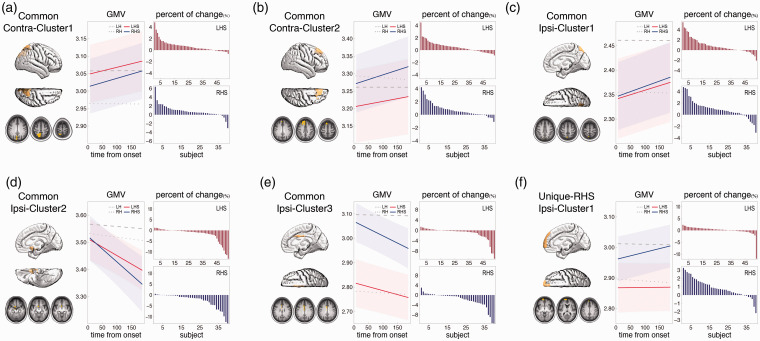
Figure 3.
Common and unique GMV changes between LHS and RHS groups. (a) Common GMV increase around the contralesional precuneus (Common Contra-Cluster1). (b) Common GMV increase around the contralesional superior frontal gyrus (Common Contra-Cluster2). (c) Common GMV increase around the ipsilesional precuneus (Common Ipsi-Cluster1). (d) Common GMV decrease around the ipsilesional medial orbital frontal gyrus (Common Ipsi-Cluster2). (e) Common GMV decrease around the ipsilesional middle cingulate cortex (Common Ipsi-Cluster3). (f) Unique-RHS GMV increase around the ipsilesional anterior medial and superior frontal cortex (Unique-RHS Ipsi-Cluster1). Within each panel, the fitted lines for longitudinal GMV changes from the linear mixed-effects model of the patients (in red and blue) and controls (in grey) are illustrated, with the shading representing the 95% confidence interval for the patients. The decreased or increased percent of raw GMV changes of all patients are illustrated as a bar figure in the panel. LH, left hemisphere of controls; RH, right hemisphere of controls; LHS, left hemisphere stroke; RHS, right hemisphere stroke.

