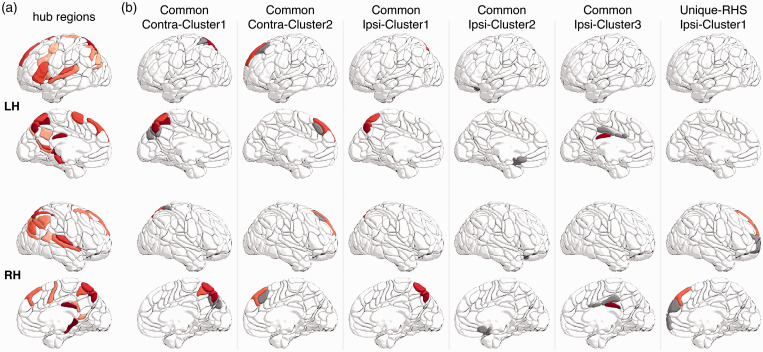
Figure 5.
Overlap of the identified common and unique regions with cortical hub regions in healthy individuals. (a) Cortical hub regions. Hub regions are denoted by red color, with darker red representing a stronger hub (i.e., more connections). (b) The intersection of AICHA regions with all identified common and unique region (Figure 3). Hub regions are highlighted in the same red color as in A and non-hub regions are denoted by grey color.

