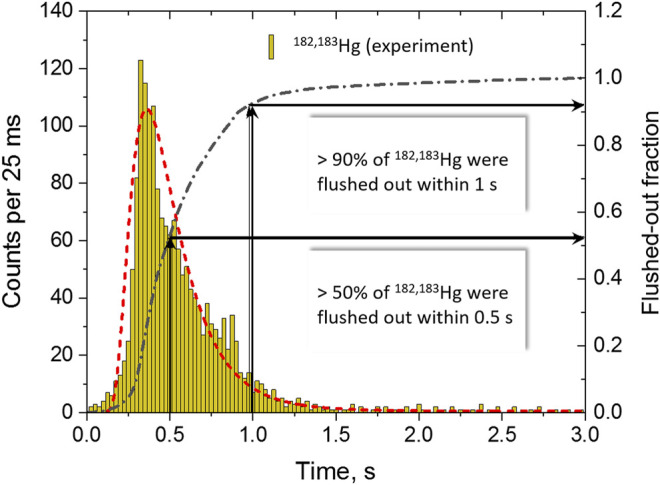
FIGURE 2.

Time distribution for the time difference between the start of 0.1 s-long irradiations and the time of decay-in-flight, measured for 182,183Hg in the first COMPACT array (yellow bars). The red dashed line is a lognormal-distribution fit function with the peak position at 0.35 s. The black dashed-dotted line represents the time-dependent function for the integrated experimental flushed-out fraction of 182,183Hg detected in the first COMPACT array within a 3 s period after the start of irradiation.
