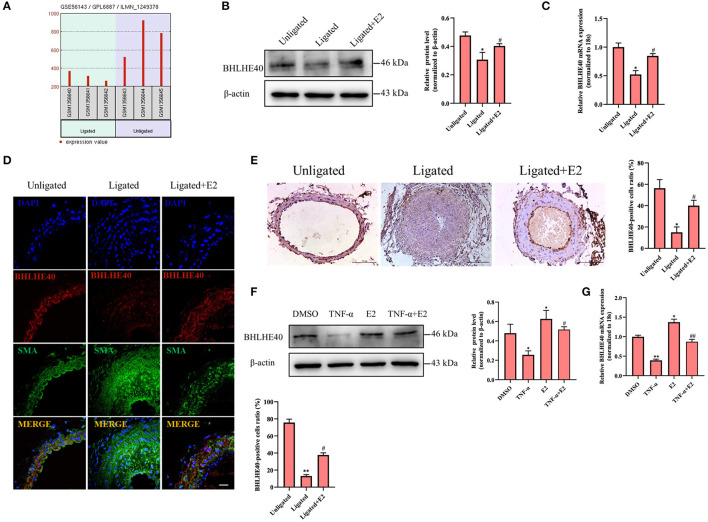
Figure 3.
E2 promotes the expression of BHLHE40 both in vivo and in vitro. (A) The data of BHLHE40 expression was downloaded from the GEO databases (GSE56143). (B,C) BHLHE40 expression in unligated, ligated and ligated + E2-treated carotid arteries was detected by Western blotting (B) and qRT-PCR (C). Statistic of band intensities is shown on the right. *p < 0.05 vs. Unligated group, #p < 0.05 vs. Ligated group. (D) Immunofluorescence staining of a-SMA (SMA; green), BHLHE40 (red) and the nucleus (DAPI; blue) in unligated, ligated and ligated + E2-treated carotid arteries. Scale bars = 25 μm. Statistics of BHLHE40-positive cells unligated, ligated and ligated + E2-treated carotid arteries is shown on the right. **p < 0.01 vs. Unligated group, #p < 0.05 vs. Ligated group. (E) Immunochemistry staining of BHLHE40 in unligated, ligated and ligated + E2-treated carotid arteries. Scale bars = 100 μm. Statistics of BHLHE40-positive cells unligated, ligated and ligated + E2-treated carotid arteries is shown on the right. *p < 0.05 vs. Unligated group, #p < 0.05 vs. Ligated group. (F,G) VSMCs were pretreated with 100 nM of E2 for 6 h and then were stimulated with TNF-α (10 ng/mL) for 24 h, the expression of BHLHE40 was determined by Western blotting (F) and qRT-PCR (G). Statistic of band intensities is shown on the right. *p < 0.05 and **p < 0.01 vs. DMSO group, #p < 0.05 and ##p < 0.01 vs. TNF-α group.

