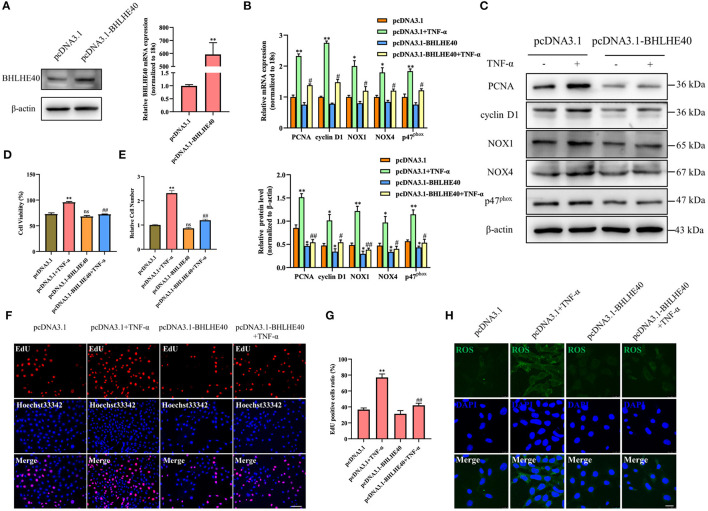
Figure 5.
Overexpression of BHLHE40 inhibits TNF-α-induced proliferation and oxidative stress in VSMC. (A) VSMCs were transfected with pcDNA3.1-BHLHE40, and the expression of BHLHE40 was detected by Western blotting and qRT-PCR. **p < 0.01 vs. pcDNA3.1 group. (B–H) VSMCs were transfected with pcDNA3.1-BHLHE40 and then treated or not with TNF-α for 24 h. The expression of PCNA, cyclin D1, NOX1, NOX4 and p47phox was determined by qRT-PCR (B) and Western blotting (C). Statistic of band intensities is shown on the left. *p < 0.05 and **p < 0.01 vs. pcDNA3.1 group, #p < 0.05 and ##p < 0.01 vs. pcDNA3.1 + TNF-α group. The cell viability was determined by MTS assay (D), and cell counting was carried out using a Countess automated counter (E). **p < 0.01 vs. pcDNA3.1 group, ##p < 0.01 vs. pcDNA3.1 + TNF-α group. Cell proliferation was detected by EdU staining (F). Scale bar = 100 μm. Analysis of the percentage of EdU positive cells (G). **p < 0.01 vs. pcDNA3.1 group, ##p < 0.01 vs. pcDNA3.1 + TNF-α group. ROS levels were detected by DCFH-DA staining (H). Scale bar = 25 μm.

