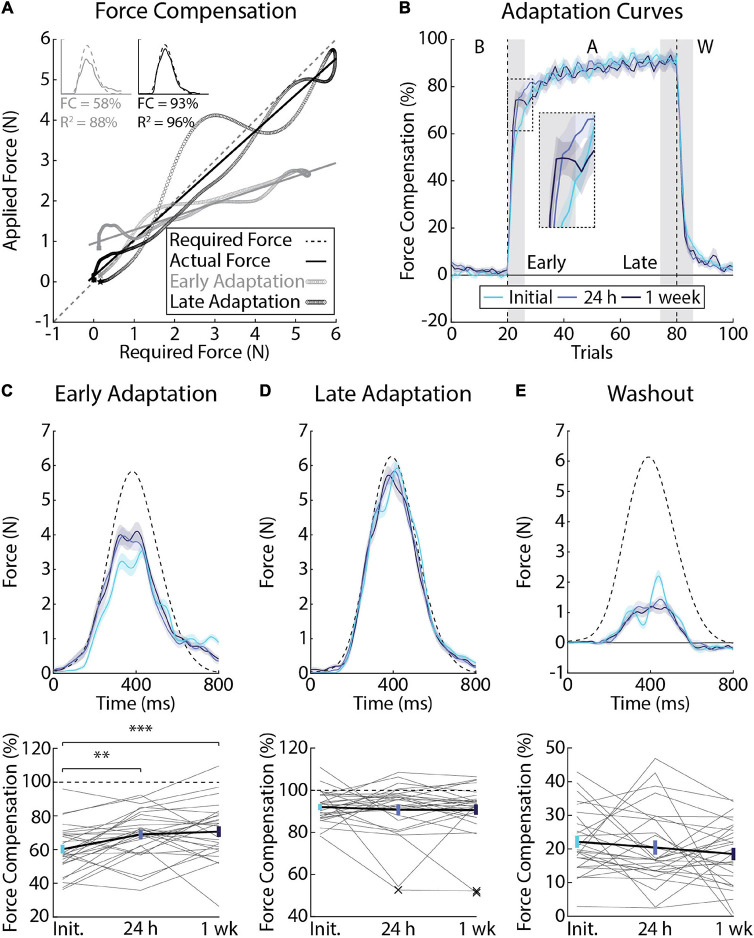
FIGURE 4.
Differences in force compensation across testing sessions (Experiment 1). (A) Force profiles and linear regression from a representative participant showing the slope calculation for a single trial at the beginning (gray) and end (black) of adaptation. The force required to counter the force field is plotted on the x-axis and the actual force applied by the participant is plotted on the y-axis. Slopes were then converted to force compensation. (B) Average force compensation over the course of the experiment (n = 28, 12 female). Lines represent the means from each session and shaded regions the corresponding SEM. Individual differences in adaptation were measured in the first (Early Adaptation, inset panel) and last 3 blocks of adaptation (Late Adaptation) as well as the first 3 blocks of Washout (shaded gray regions). (C) Average force profiles and force compensation during Early Adaptation. Top: dashed line represents the ideal amount of force required to counter the force field, had it been applied. Solid lines represent mean force profiles and shaded regions indicate SEM. Bottom: gray lines indicate individual participant data measured across sessions. Error-bars indicate mean and SEM during Early Adaptation. Dashed line indicates force compensation = 100%. (D) Average force profiles and force compensation during Late Adaptation. “X” indicates multivariate outliers (Mahalanobis distance) that were excluded from the analysis. (E) Average force profiles and force compensation during Washout. Data in panels (D,E) are presented in the same manner as panel (C). **p < 0.01 and ***p < 0.001 after Bonferroni corrections (corrected for 3 comparisons).

