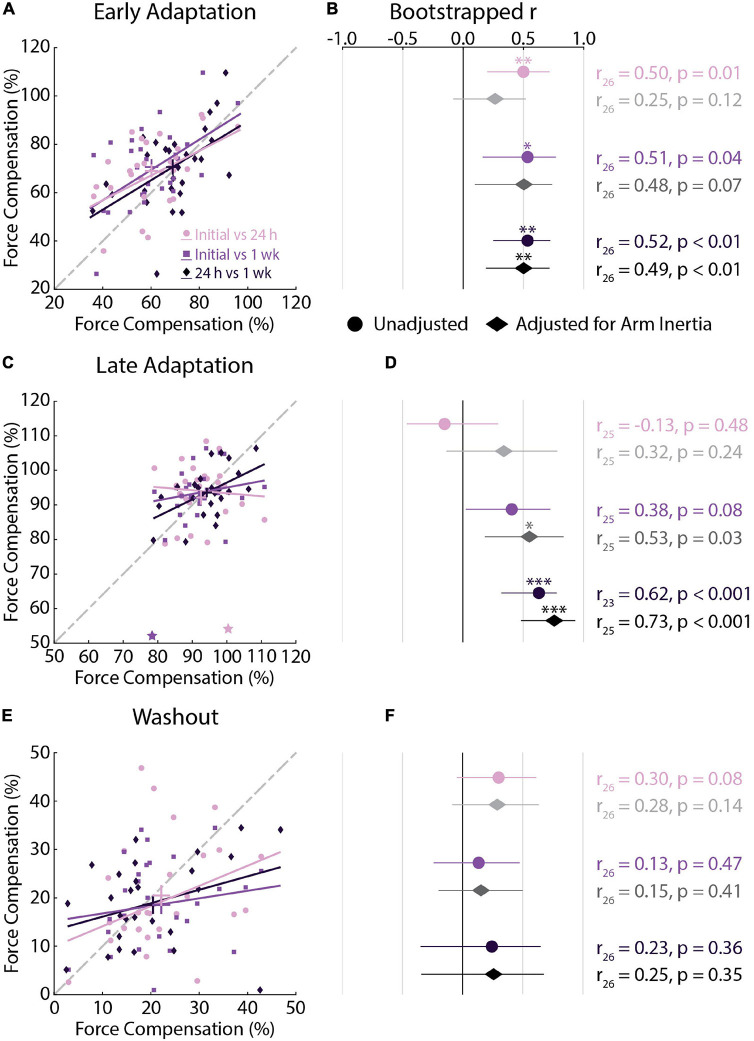
FIGURE 5.
Force compensation correlations across testing sessions (Experiment 1). (A) Correlations between force compensation in Early Adaptation across all sessions. For each correlation, the earlier session is represented on the x-axis and later session on the y-axis. Bars represent the mean and SEM. Trendlines were obtained via robust linear regression and are used for visualization purposes. The dashed gray line represents unity. (B) Mean and 95% confidence intervals (CI) of the bootstrapped Pearson’s r distributions are shown for each correlation (circles) and for the partial Pearson’s correlations adjusted for arm inertia (diamonds). (C,D) Correlations between force compensation in Late Adaptation across all sessions. (E,F) Correlations between force compensation in Washout across all sessions. Data in panels (C–F) are presented in the same manner as panels (A,B). (C) Stars indicate observations that did not reach the critical value for outlier detection. The results were not different with and without these observations. *p < 0.05, **p < 0.01, ***p < 0.001 after Bonferroni corrections (corrected for 3 correlations).

