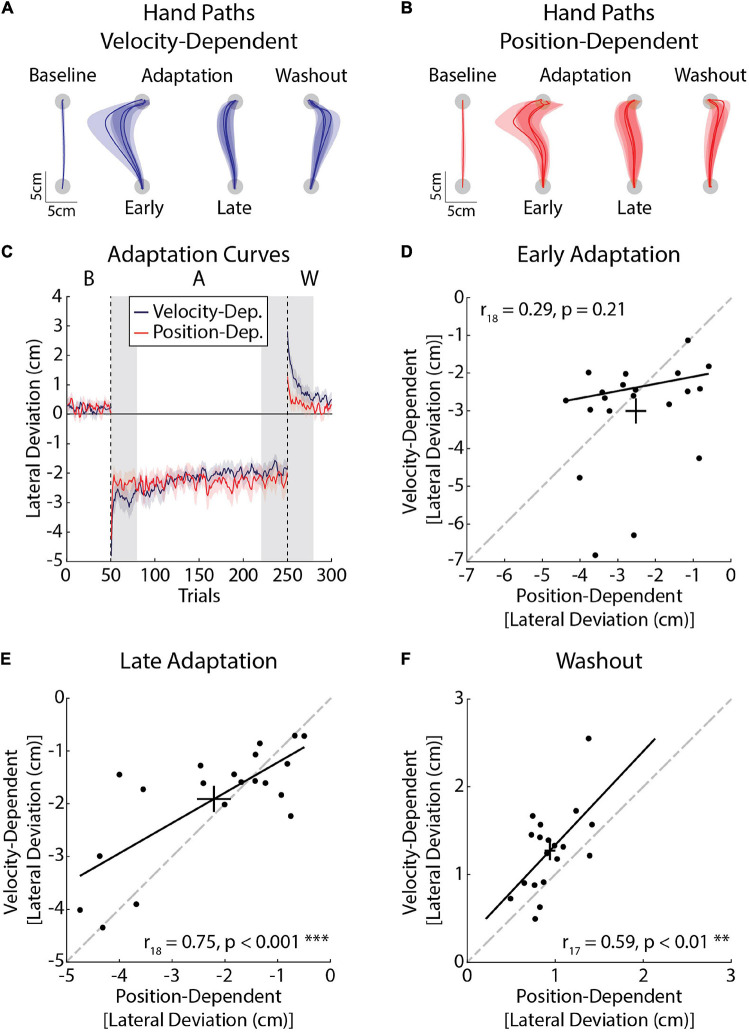
FIGURE 6.
Kinematic differences in adaptation in velocity- (blue) and position-dependent (red) force fields (Experiment 2a). (A) Average hand paths from the velocity-dependent force field. Hand paths were averaged across the baseline phase. The first and last three trials of the adaptation phase were averaged across participants. Similarly the first three trials of the washout phase were averaged across participants. (B) Average hand paths from the position-dependent force field. Hand paths are presented in the same manner as panel (A). (C) Peak lateral deviations throughout the experiment (n = 20, 10 female). Solid lines represent the group mean and surrounding shaded regions represent the SEM. Individual differences in adaptation were measured in Early Adaptation, Late Adaptation, and Washout (shaded gray regions). (D) Average peak lateral deviations measured in Early Adaptation in each task. Peak lateral deviations for the position-dependent forces are plotted on the x-axis and peak lateral deviations for the velocity-dependent forces are plotted on the y-axis. Error bars represent the mean and SEM. The trendline was obtained via robust linear regression and is used for visualization purposes. The dashed line represents unity. (E) Average peak lateral deviations measured in Late Adaptation. (F) Average peak lateral deviations measured in Washout. Results in panels (E,F) are presented in the same format as panel (D). **p < 0.01 and ***p < 0.001 after Bonferroni corrections (corrected for 3 comparisons).

