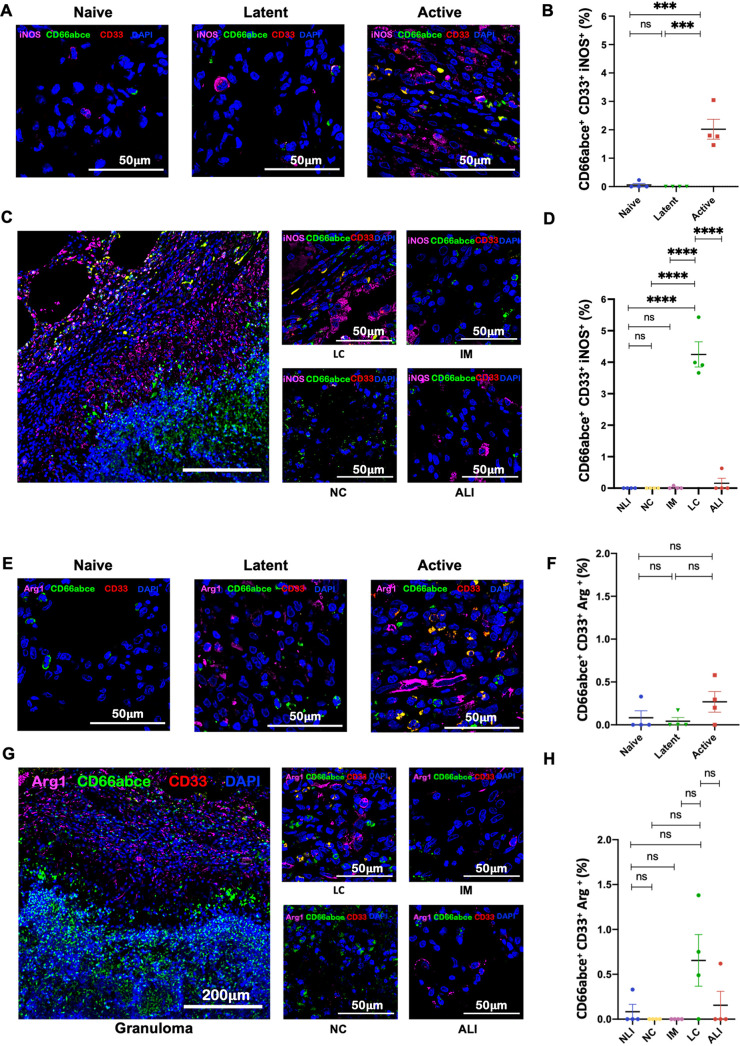
FIG 5.
PMN-MDSCs in the lungs of M. tuberculosis-infected macaques express iNOS but not arginase. (A and E) Multilabel confocal images exhibiting the expression of iNOS (A) and arginase (E) by PMN-MDSCs in sections of naive, LTBI, and ATB lungs. (B and F) Graphical representation of the fractions of PMN-MDSCs expressing iNOS (CD66abce+ CD33+ iNOS+) (B) and arginase (CD66abce+ CD33+ Arg+) (F) in naive, LTBI, and ATB groups. Shown are the images depicting the distribution of iNOS+ PMN-MDSCs (C) and arginase+ PMN-MDSCs (G) in various layers of granuloma. (D and H) Estimated fractions revealing the distribution of PMN-MDSCs expressing iNOS (CD66abce+ CD33+ iNOS+) (D) and PMN-MDSCs expressing arginase (CD66abce+ CD33+ Arg+) (H) in the necrotic core (NC), intermediate myeloid layer (IM), lymphocytic cuff (LC), active lung interstitium (ALI), and naive lung interstitium (NLI). Statistical significance by one-way ANOVA with Tukey’s multiple-testing correction: *, P < 0.05; **, P < 0.01; ***, P < 0.001; ****, P < 0.0001. Data represent mean ± SEM (n = 4).

