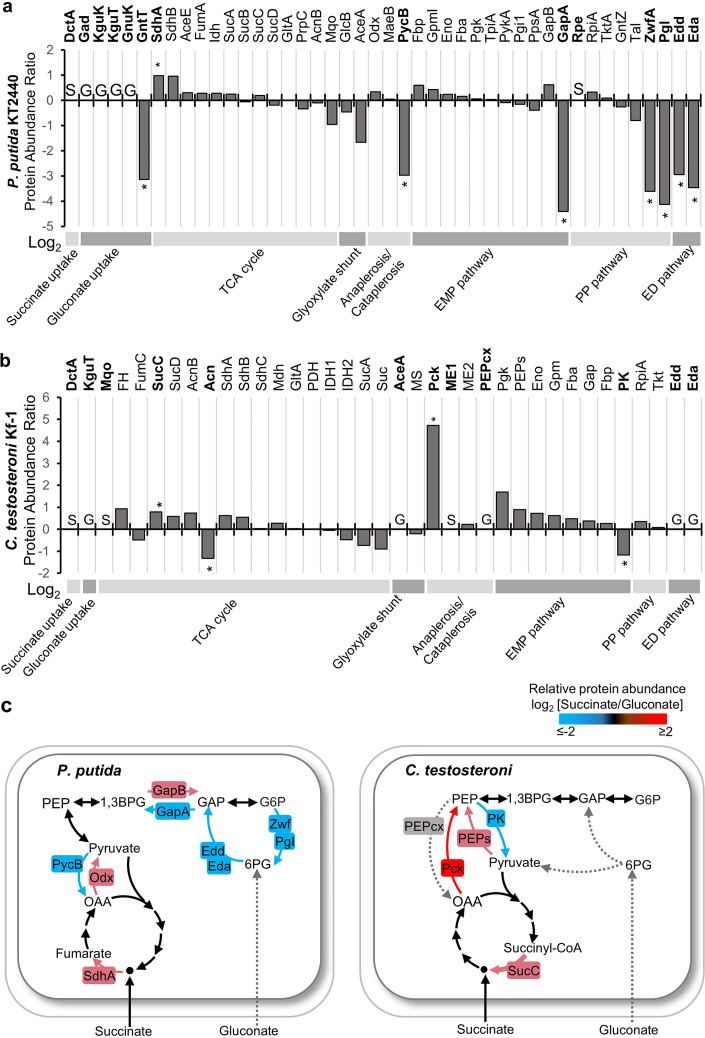
FIG 3.
Enzyme-level regulation of selective metabolic nodes to facilitate gluconeogenic carbon flow. (a and b) Shown are the log2 fold change in protein content in succinate-grown cells relative to gluconate-grown cells of (a) P. putida KT2440 and (b) C. testosteroni KF-1. Protein names in bold represent proteins only found in one growth condition or proteins with significant differences between conditions. The asterisk (*) denotes significant differences in protein abundance ratios with a P value less than 0.05 after correction for false-discovery rate. Abbreviations: S, proteins only detected during growth on succinate; G, proteins only detected during growth on gluconate. Data were obtained from four biological replicates. (c) Key species-specific regulation points associated with gluconeogenic growth identified by elevation (shades of red) and depletion (shades of blue) of specific proteins during growth on succinate relative to growth on gluconate. Dotted gray lines indicate that the enzymes in the pathway were only detected during growth on gluconate. Abbreviations for the metabolites are described in Fig. 1.

