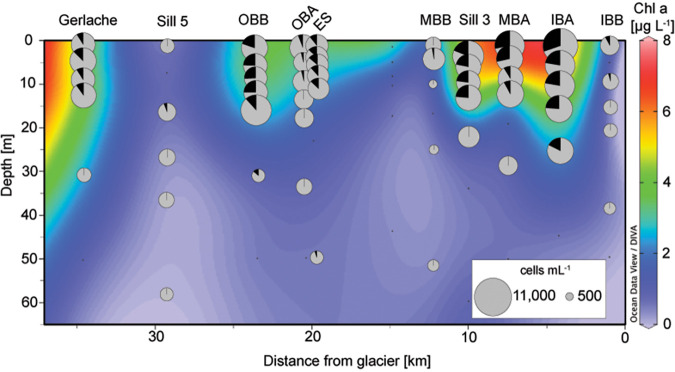
FIG 3.
Flow cytometry-based phytoplankton abundances across austral spring depth profiles. Cross section of the upper 65 m of the spring transect showing chlorophyll a (Chl a) concentration in the background with cell abundance overlaid (pie charts). Black represents the proportion of total cells that were identified as cryptophytes, while gray represents all other photosynthetic cells. The size of each pie chart is scaled to the total number of cells enumerated.

