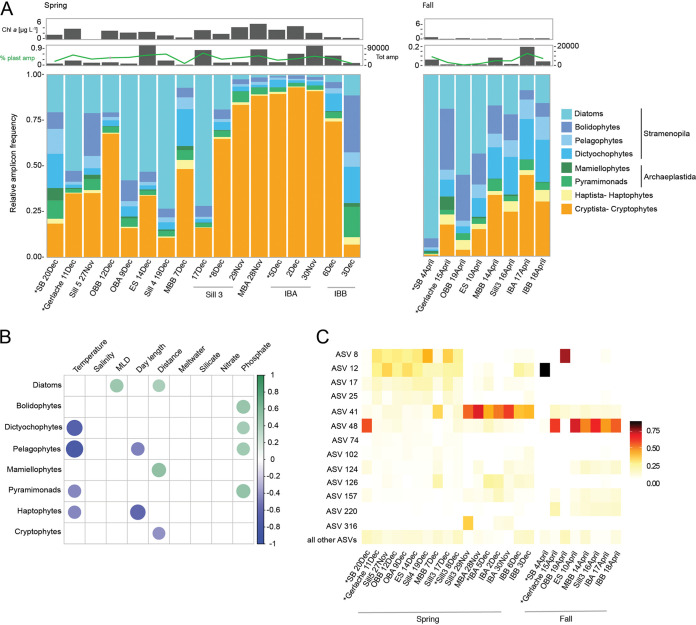
FIG 4.
Phytoplankton diversity, distribution, and environmental relationships. (A) Relative 16S rRNA gene amplicon frequency for samples taken during austral spring and fall, based on PhyloAssigner classification. The topmost gray bar plot represents Chl a concentrations corresponding to each DNA sample. The lower gray bar plot shows the total number of plastid amplicons sequenced with the percentage of total amplicons that were identified as plastid sequences overlaid as a light green line. An asterisk (*) indicates samples that were also analyzed by 18S rRNA amplicon sequencing (see Fig. 2). (B) Heatmap showing the significant Pearson’s correlations (P ≤ 0.05) between environmental factors and relative amplicon frequency of phytoplankton taxa. Pairwise correlations without an assigned colored dot represent correlations that are not significant. (C) Heatmap of the distribution of diatom ASVs as the percentage of total PhyloAssigner-classified diatom amplicons. Shown are the top 10 ASVs, as well as ASVs that formed >10% of the total diatom amplicons in at least one sample. The less frequently observed diatom ASVs were summed and are represented here as “all other ASVs.”

