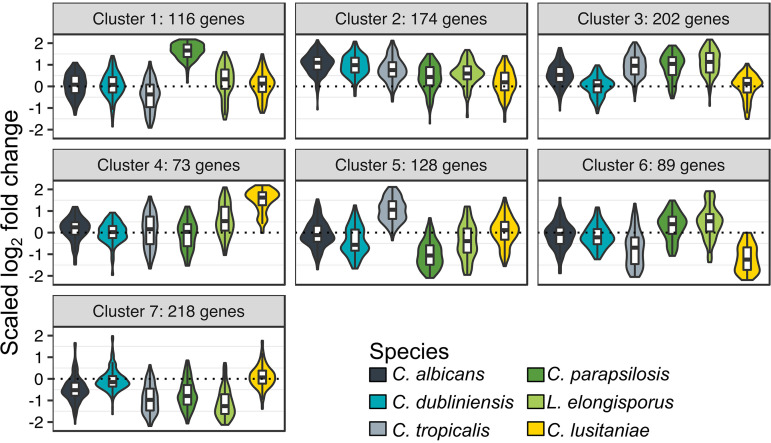
FIG 3.
Cluster analysis reveals species-specific differences in phagocytosis response. k-medoids clustering of the 1,000 genes showing the most variance in log2 fold change (LFC) across species. LFCs are scaled by division by the root mean square. Scaled LFCs for each cluster are shown as violin plots, with box plots showing median and quartiles superimposed. Plots are color coded by species according to the legend.

