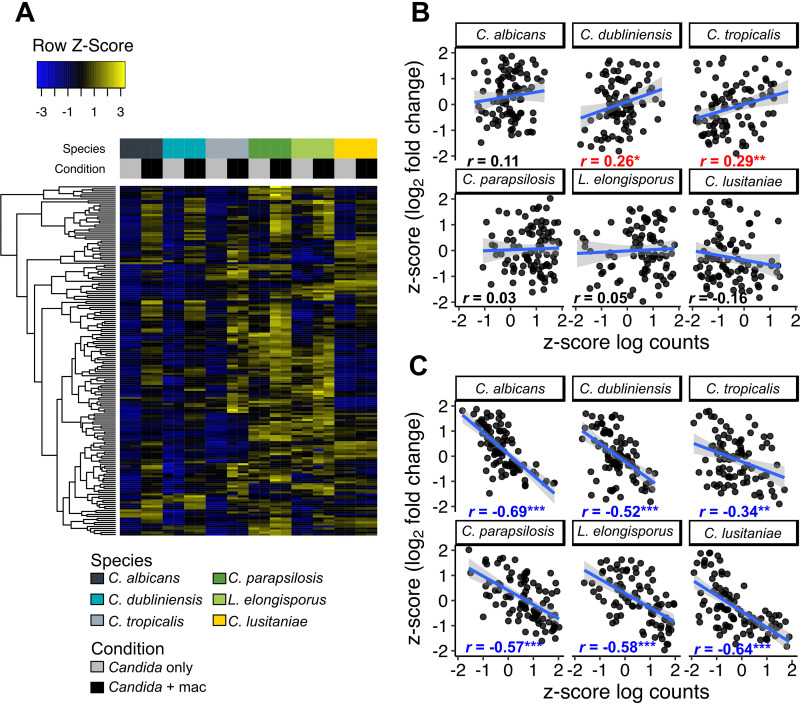
FIG 4.
Variably induced genes show convergence in expression levels upon phagocytosis. (A) Heatmap of mean-centered, log-transformed fragment counts of genes in cluster 2 (Fig. 3). Hierarchical clustering of genes was performed using Euclidean distances. (B and C) For all 92 core response genes, log2 fold change and mean log-transformed gene counts for Candida with macrophage samples (B) or Candida-only samples (C) were converted into z-scores. Plots are shown for each species individually with a linear regression line fitted (in blue, with gray-shaded areas representing 95% confidence intervals). Pearson correlation coefficients are shown for each species, and asterisks mark a significant relationship between z-scores (linear model, *, P < 0.05; **, P < 0.01; ***, P < 0.001). Blue text indicates a significant inverse relationship, and red indicates a significant positive relationship.

