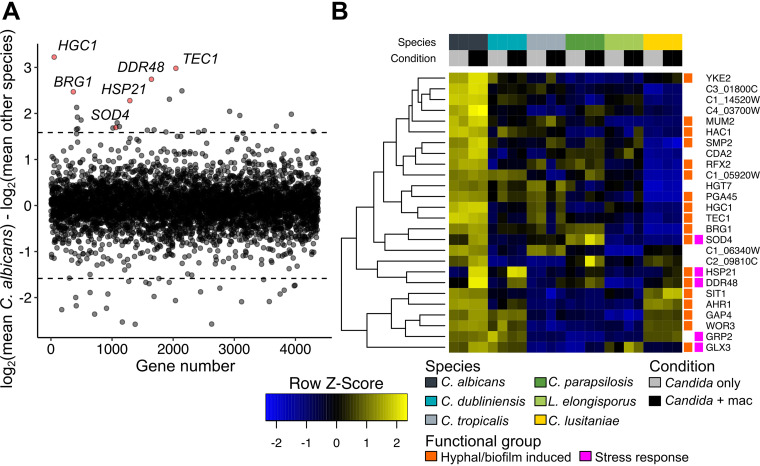
FIG 5.
Identification of genes more highly expressed in C. albicans than other species. (A) The mean macrophage log-transformed fragment counts of all non-albicans Candida species were subtracted from the mean macrophage log-transformed fragment counts for C. albicans. Dotted lines indicate a 3-fold difference in expression (log2 difference of 1.58) in C. albicans from the mean for other species. Selected genes of interest are highlighted in red. (B) Heatmap of mean-centered, log2-transformed read counts of genes that are at least 3-fold more highly expressed in C. albicans macrophage samples compared to the mean for other species. Hierarchical clustering of genes was performed using Euclidean distances. Underlying data and equivalent analyses for C. parapsilosis and C. tropicalis are found in Table S3. Genes previously associated with either hyphal morphogenesis or biofilm formation, as well as stress responses, are indicated.

