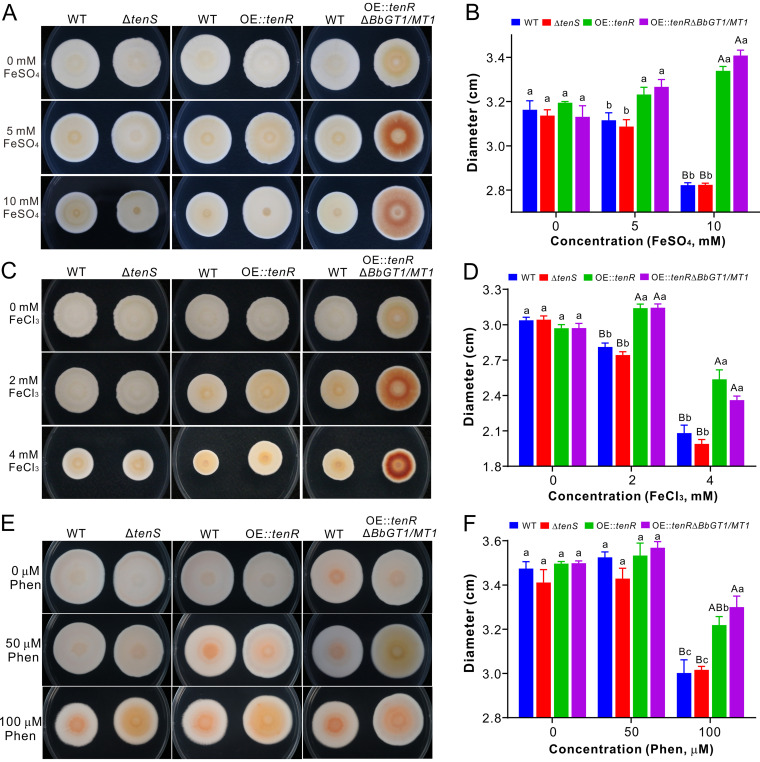
FIG 6.
Iron stress responses. (A and B) Phenotyping and comparison of different B. bassiana strains after growth on PDA amended with different concentrations of FeSO4 for 15 days. (C and D) Phenotyping and comparison of different strains after growth on PDA amended with different concentrations of FeCl3 for 15 days. (E and F) Phenotyping and comparison of different strains after growth on PDA amended with different concentrations of the iron chelator phenanthroline (Phen) for 15 days. Different letters above each column indicate the level of difference between samples at the level of a P value of <0.01 (for uppercase letters) or a P value of <0.05 (for lowercase letters) after one-way ANOVA.

