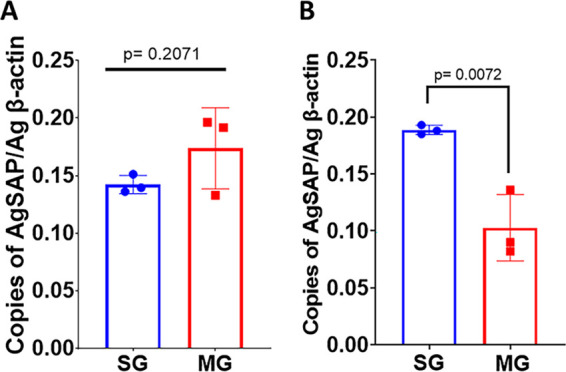
FIG 1.

Expression analyses of AgSAP. A. gambiae mosquitoes (n = 10) (uninfected [A] and infected [21 days postinfection] with P. berghei [B]) were dissected to isolate salivary glands (SGs) and midguts (MGs). The tissues were collected in TRIzol reagent, and total RNA was extracted. qRT-PCR analysis was performed to compare the expression levels of AgSAP in SGs and MGs from uninfected mosquitoes (A) and P. berghei-infected mosquitoes (B). The bar graphs represent the relative expression levels of AgSAP normalized to the A. gambiae β-actin gene, and error bars represent means ± SD.
