Figure 4.
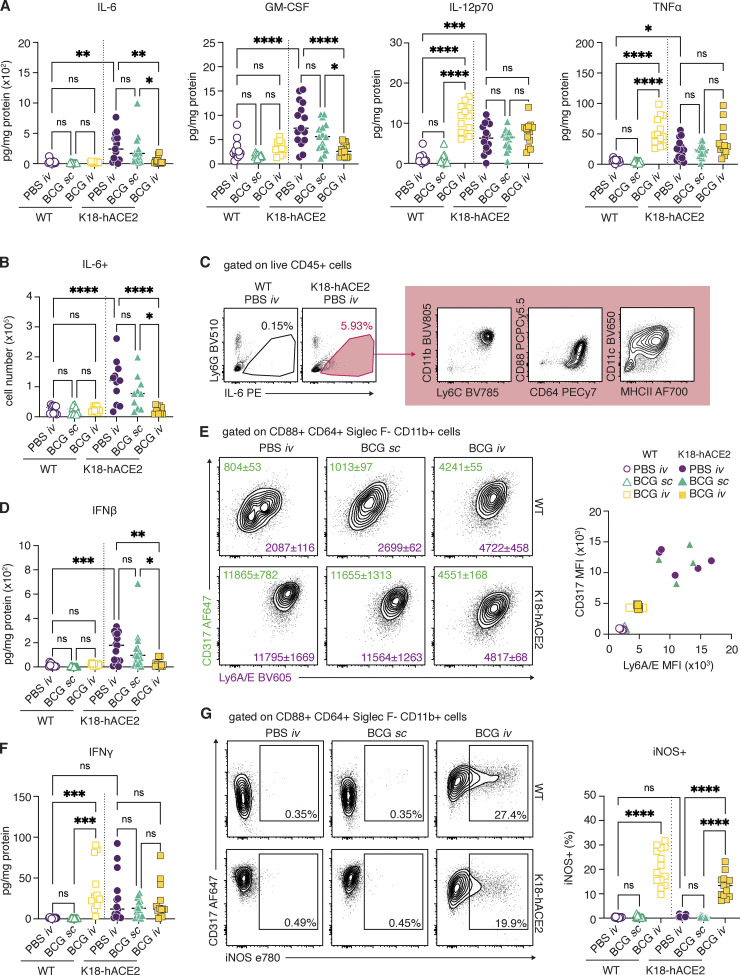
BCG i.v. inoculation alters the inflammatory cytokine milieu of the lung following SCV2 challenge. (A–G) K18-hACE2 mice or non-transgenic littermate controls (WT) were inoculated with 106 CFUs BCG Pasteur by s.c. or i.v. routes. Control animals received the same volume of PBS i.v. At 42 d after BCG administration, mice were infected with 103 TCID50 SCV2 (WA1/2020) by i.n. instillation. Lungs were collected 5 d after viral challenge and assessed by flow cytometry and cytokine multiplexing. (A) IL-6, GM-CSF, IL-12p70, and TNF-α levels in lung homogenate standardized to total protein concentration. (B) Number of IL-6+ cells as determined by flow cytometry. (C) Gating of IL-6+ cells from total CD45+ cells and surface marker expression of IL-6+ cells from K18-hACE2 PBS i.v. animals. Plots show data concatenated from five animals and are representative of two independent experiments. (D) IFN-β levels in lung homogenate standardized to total protein concentration. (E) Representative contour plots depict CD317 (green) and Ly6A/E (purple) expression by CD88+ CD64+ Siglec F− CD11b+ macrophages (left). Median fluorescence intensity (MFI) ± SEM is indicated on the plots (n = 4–5). MFI values for individual animals are shown on the right. (F) IFN-γ levels in lung homogenate standardized to total protein concentration. (G) Representative contour plots depict CD317 and iNOS expression by CD88+ CD64+ Siglec F− CD11b+ macrophages (left). Frequency of iNOS+ macrophages are shown on the right. Statistical significance was assessed by one-way ANOVA with Tukey post hoc test. ns, P > 0.05; *, P < 0.05; **, P < 0.01; ***, P < 0.001; ****, P < 0.0001. Unless otherwise stated, data are pooled from three independent experiments each with four to five mice per group. Flow cytometry gating strategy is shown in Fig. S2.

